
Jefferies Financial Group (JEF) recently posted third quarter results showing higher year over year revenue and net income, while also reaffirming its quarterly dividend. This combination is now shaping how investors view the stock.
The quarterly update follows a tougher stretch for Jefferies Financial Group shareholders, with the share price down 14.6% over the past month and 30.1% year to date. However, the three-year total shareholder return of 42.5% points to a much stronger longer-run outcome.
Compare Jefferies Financial Group's recent earnings and dividend momentum with a curated group of financially resilient companies. Use the 31 resilient stocks with low risk scores as a starting universe.
Jefferies Financial Group now looks like a business with clear earnings momentum, but the share price has dropped sharply in recent weeks. Are you looking at a quality franchise on sale, or a value trap in the making?
Price-to-Earnings of 11.9x: Is it justified?
Jefferies Financial Group trades on a P/E of 11.9x, and that looks modest when set against both its recent earnings profile and how peers are priced. With the last close at $44.38, the key question is whether the market is giving enough credit to the recent pickup in profitability.
The P/E ratio compares the current share price to earnings per share, so it effectively shows how many dollars investors are paying for each dollar of profit. For a capital markets business like Jefferies Financial Group, this lens is useful because earnings are a direct output of deal flow, trading activity, and how efficiently capital is used.
Recent numbers show annual earnings growth of 33.6%, which is ahead of the Capital Markets industry rate of 30.8%, and current net profit margins of 10.1% compared with 8.9% last year. Against that backdrop, a P/E of 11.9x sits well below both the peer average of 30.3x and the broader US Capital Markets industry average of 38.1x. The estimated fair P/E of 13.3x is also higher than where the shares are priced today, which indicates that the valuation multiple could move closer to that level if the profitability trend holds.
Explore the SWS fair ratio for Jefferies Financial Group.
Result: Price-to-Earnings of 11.9x (UNDERVALUED)
Still, Jefferies Financial Group remains exposed to swings in capital markets activity, and any setback in deal flow or trading volumes could challenge that earnings momentum.
Find out about the key risks to this Jefferies Financial Group narrative.
Another view on Jefferies Financial Group’s value
The P/E story points one way, but the SWS DCF model adds a second anchor. On that framework, Jefferies Financial Group’s share price of $44.38 sits below an estimated future cash flow value of $47.87, which again implies an undervalued setup. Could both signals be wrong, or is the discount telling you something?
Look into how the SWS DCF model arrives at its fair value.
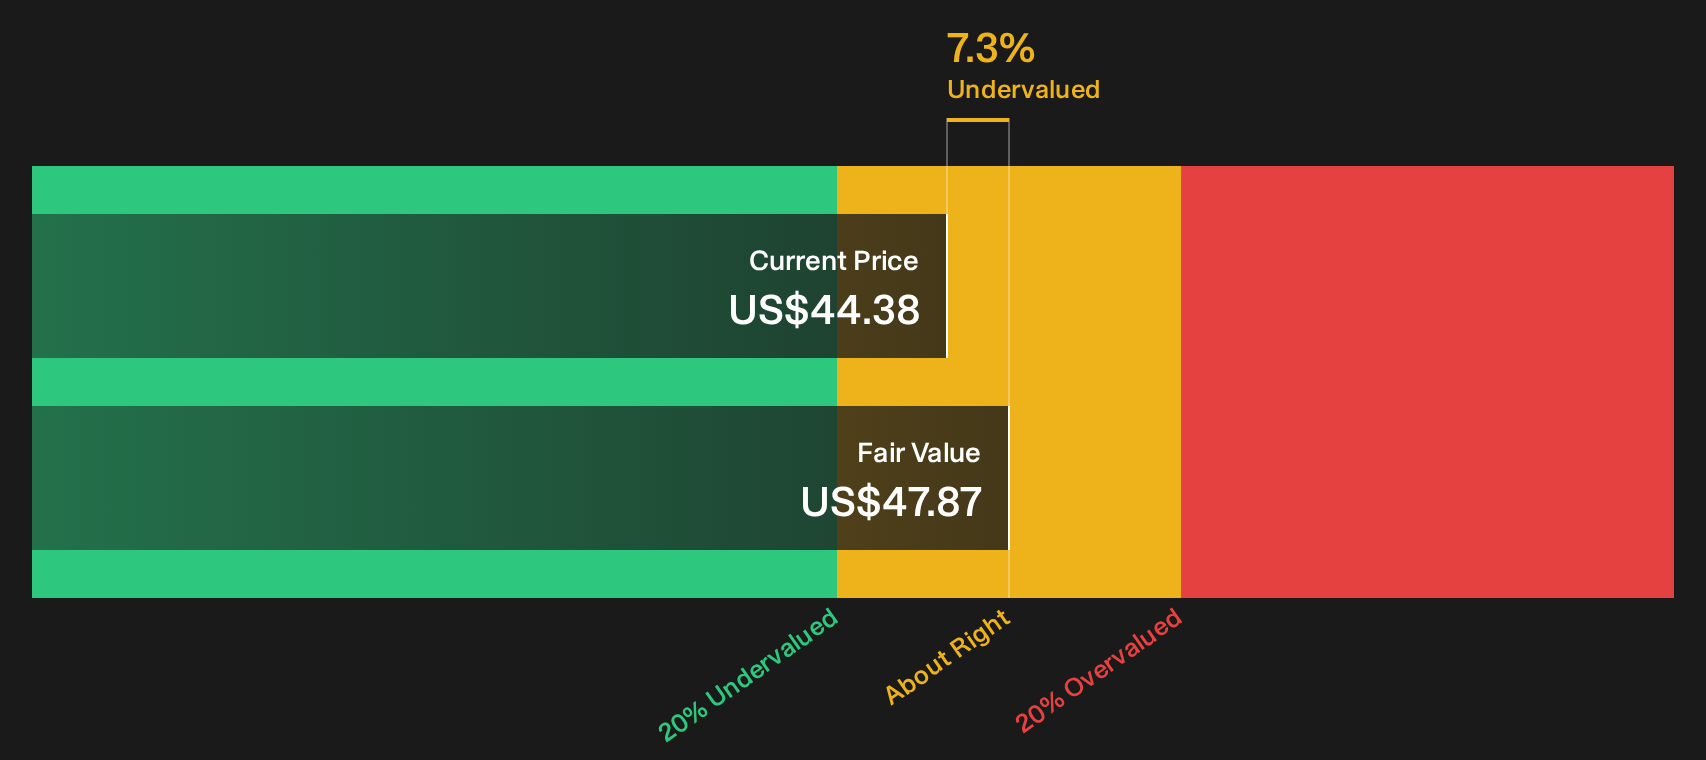
Simply Wall St performs a discounted cash flow (DCF) on every stock in the world every day (check out Jefferies Financial Group for example). We show the entire calculation in full. You can track the result in your watchlist or portfolio and be alerted when this changes, or use our stock screener to discover 29 high quality undervalued stocks. If you save a screener we even alert you when new companies match - so you never miss a potential opportunity.
Next Steps
Curious whether the mood around Jefferies Financial Group matches your own read of the numbers and risks? Act quickly, test the assumptions here against the data, and judge the optimism baked into 6 key rewards.
Looking for more Jefferies Financial Group investment ideas?
If Jefferies Financial Group has sharpened your focus, do not stop here. Broaden your opportunity set with data driven stock ideas tailored to different goals.
- Target resilient compounding by scanning companies with strong fundamentals and robust finances using the list of solid balance sheet and fundamentals (25 results).
- Hunt for mispriced opportunities by reviewing the 29 high quality undervalued stocks before other investors catch on.
- Build a cash focused portfolio by starting with the income heavy universe in the 8 dividend fortresses.
This article by Simply Wall St is general in nature. We provide commentary based on historical data and analyst forecasts only using an unbiased methodology and our articles are not intended to be financial advice. It does not constitute a recommendation to buy or sell any stock, and does not take account of your objectives, or your financial situation. We aim to bring you long-term focused analysis driven by fundamental data. Note that our analysis may not factor in the latest price-sensitive company announcements or qualitative material. Simply Wall St has no position in any stocks mentioned.
Have feedback on this article? Concerned about the content? Get in touch with us directly. Alternatively, email editorial-team@simplywallst.com