
Arthur J. Gallagher (AJG) came back into focus after recent trading left the stock down about 9% year to date, with the share price closing at US$232.70 on 9 October 2026.
Over the past few months, Arthur J. Gallagher has seen momentum fade. The 30-day share price return is down 3.17% and the 90-day share price return is down 8.32%. This has contributed to a year-to-date share price decline of 9.10% and a 1-year total shareholder return down 20.99%, while the 5-year total shareholder return remains positive at 52.57%.
Scan how Arthur J. Gallagher compares with other insurers by reviewing a curated set of list of solid balance sheet and fundamentals (25 results)
Arthur J. Gallagher now trades well below recent highs while still carrying healthy reported revenue and net income growth. Does that pullback finally tilt the risk reward balance toward buyers, or is the valuation still demanding?
Most Popular Narrative: 18% Undervalued
Against the last close of $232.70, the most followed narrative pegs Arthur J. Gallagher’s fair value materially higher, using a 7.24% discount rate to weigh those future cash flows and earnings assumptions.
Broader adoption of digital tools, enhanced data analytics and AI projects inside Arthur J. Gallagher’s operations is now backed by explicit targets for 5% production layer, 10 to 15% support layer and 20 to 30% back office cost savings over 3 to 5 years. If achieved, this would flow through to higher underlying EBITDAC margins and earnings. Successful, disciplined execution of the ongoing M&A strategy, including the AssuredPartners integration with an increased synergy target of up to US$325m of run rate savings by early 2028 and an M&A pipeline supported by about US$10b of capital deployment capacity over the next two years, can add incremental revenue and EBITDAC.
See why 22 investors see Arthur J. Gallagher as 18% undervalued.
Result: Fair Value of $284.72 (UNDERVALUED)
Still, the narrative can crack if property insurance pricing keeps easing and if Arthur J. Gallagher’s acquisition pipeline stays slower, which could delay expected synergies and cost savings.
Find out about the key risks to this Arthur J. Gallagher narrative.
Another View: Arthur J. Gallagher Looks Expensive On Earnings
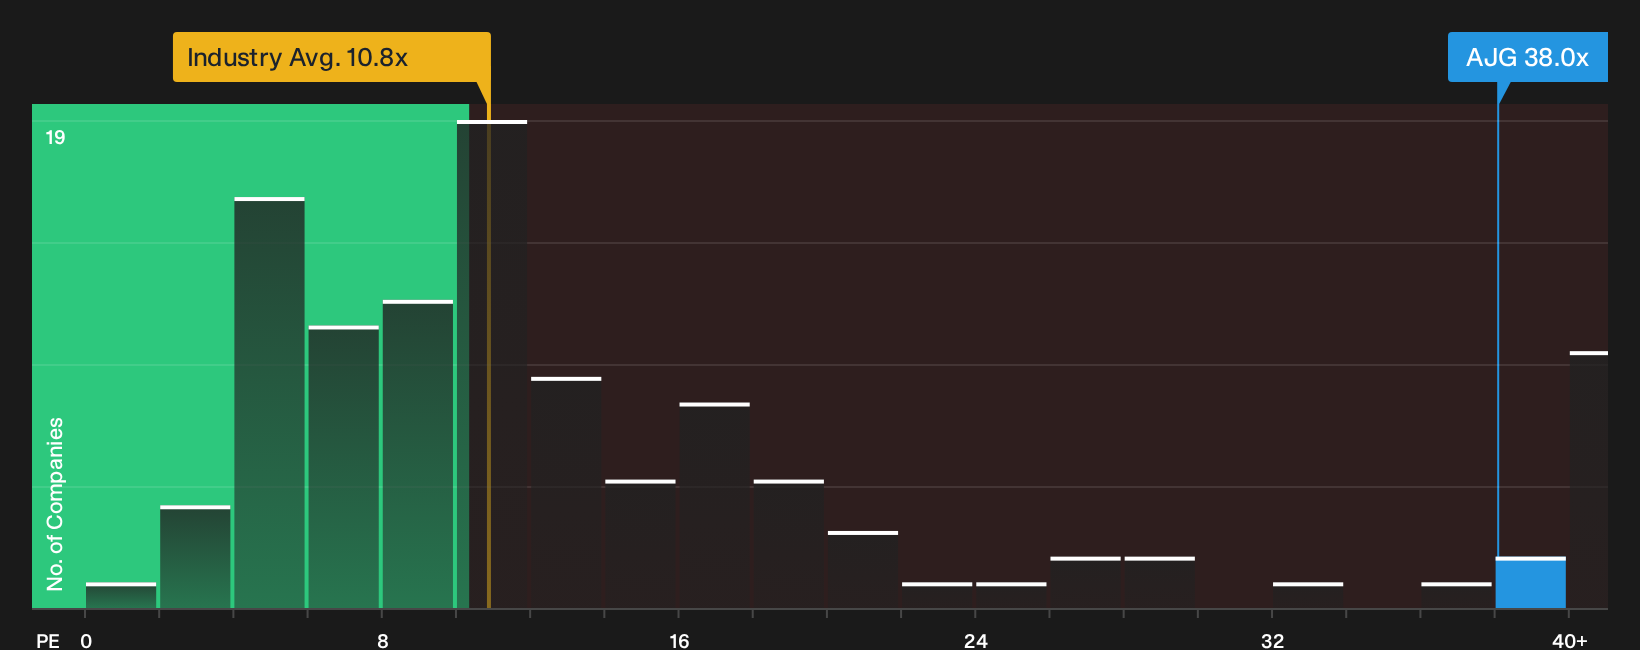
The SWS DCF model points to upside, but the simple earnings multiple tells a different story. Arthur J. Gallagher trades on a P/E of 38x, compared with 17.8x for peers and a fair ratio of 14.9x. That gap suggests meaningful valuation risk if sentiment or growth expectations cool from here.
For a closer look at how that richer multiple compares with peers and the fair ratio, and what it could mean for future returns, See what the numbers say about this price — find out in our valuation breakdown.
Next Steps
Given that the Arthur J. Gallagher story mixes both optimism and concern, it pays to move fast and test the numbers yourself rather than lean on consensus alone. To see both sides clearly, start with the 3 key rewards and 3 important warning signs.
Ready for more ideas beyond Arthur J. Gallagher?
Do not stop at Arthur J. Gallagher alone. Broaden your watchlist with fresh opportunities surfaced by the Simply Wall St screener and stress test your portfolio with new angles.
- Target steadier portfolio anchors by reviewing a curated mix of resilient companies through the 31 resilient stocks with low risk scores.
- Hunt for mispriced opportunities before the crowd notices by scanning the 20 high quality undiscovered gems.
- Strengthen your income stream by assessing reliable payers using the 8 dividend fortresses.
This article by Simply Wall St is general in nature. We provide commentary based on historical data and analyst forecasts only using an unbiased methodology and our articles are not intended to be financial advice. It does not constitute a recommendation to buy or sell any stock, and does not take account of your objectives, or your financial situation. We aim to bring you long-term focused analysis driven by fundamental data. Note that our analysis may not factor in the latest price-sensitive company announcements or qualitative material. Simply Wall St has no position in any stocks mentioned.
Have feedback on this article? Concerned about the content? Get in touch with us directly. Alternatively, email editorial-team@simplywallst.com