
Lululemon Athletica (LULU) has just reshaped its senior ranks by creating new roles for president and chief product officer and chief operating officer, while also launching searches for three more C-suite hires.
For investors, the leadership overhaul comes after a difficult stretch for lululemon athletica’s stock. The share price has fallen 20.76% over the past 90 days and is down 55.17% year to date. The 1 year total shareholder return has declined 43.59%, pointing to fading momentum as earnings pressure and brand challenges have built up, despite today’s 1 day share price gain of 1.96% to US$94.50.
Scan how other consumer names under pressure are setting up their next chapter by comparing lululemon athletica with our hand picked 28 high quality undervalued stocks.
Lululemon athletica is now trading well below where the share price sat a year ago, even after the leadership shake up bump. Has most of the reset already been priced in, or is the remaining downside what investors should focus on?
Most Popular Narrative: 32% Undervalued
Lululemon athletica’s most followed narrative pegs fair value at $139, which sits well above the last close at $94.50 and frames the leadership reset against a market that already marked the stock down hard.
The price is the price. The numbers are the numbers. The crowd is welcome to its conviction.
See why 49 investors see lululemon athletica as 32% undervalued.
Result: Fair Value of $139 (UNDERVALUED)
Still, this investment thesis, which suggests a 32% undervaluation, depends on a brand and earnings profile that recent Americas weakness and repeated guidance cuts have already started to challenge.
Find out about the key risks to this lululemon athletica narrative.
Another View: SWS DCF Model Puts lululemon athletica In A Different Light
The popular 32% undervalued narrative leans on a fair value of $139 for lululemon athletica. Our DCF model paints a cooler picture. On this framework, the stock at $94.50 trades above an estimated future cash flow value of $83.92, which points to overvaluation instead of a bargain. That leaves you weighing brand recovery optimism against a cash flow profile that does not yet support it.
For readers who want to see how this cash flow based view is built line by line, Look into how the SWS DCF model arrives at its fair value.
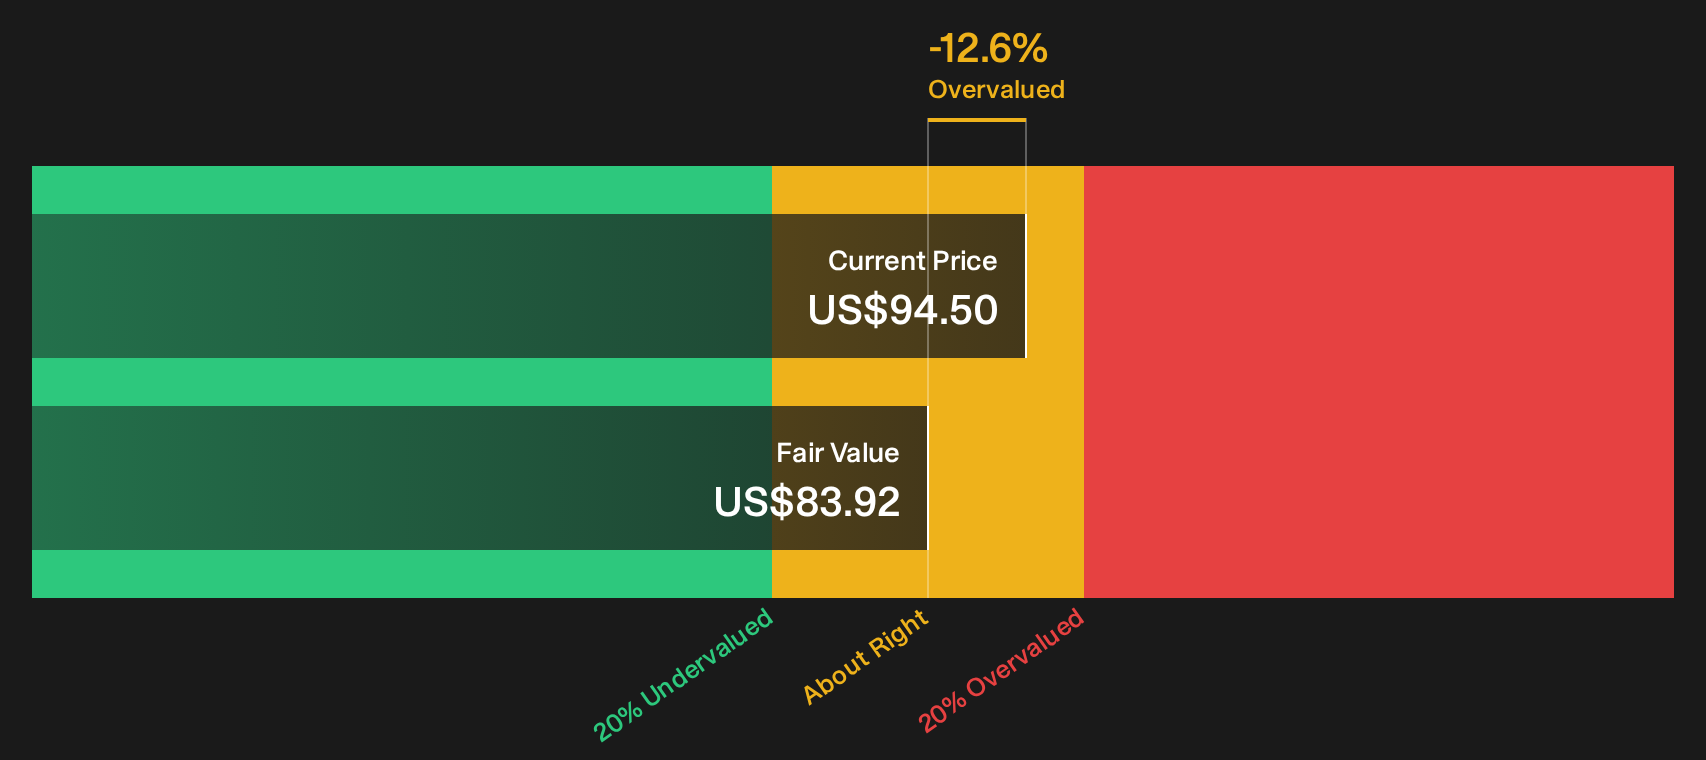
Simply Wall St performs a discounted cash flow (DCF) on every stock in the world every day (check out lululemon athletica for example). We show the entire calculation in full. You can track the result in your watchlist or portfolio and be alerted when this changes, or use our stock screener to discover 28 high quality undervalued stocks. If you save a screener we even alert you when new companies match - so you never miss a potential opportunity.
Next Steps
Mixed signals like this usually split opinion, so move quickly, review the same numbers, and pressure test what they imply for your own thesis using the 2 key rewards and 1 important warning sign.
Looking for more investment ideas beyond lululemon athletica?
If the mixed signals around lululemon athletica leave you undecided, use this moment to widen your watchlist and spot other setups before the crowd does.
- Target resilient income by reviewing companies that appear to offer robust payout profiles and balance their yield through the 8 dividend fortresses.
- Hunt for quality at a discount by scanning businesses that combine fundamentals with appealing valuations using the 28 high quality undervalued stocks.
- Protect the downside by focusing on companies that score well on resilience and financial risk using the 31 resilient stocks with low risk scores.
This article by Simply Wall St is general in nature. We provide commentary based on historical data and analyst forecasts only using an unbiased methodology and our articles are not intended to be financial advice. It does not constitute a recommendation to buy or sell any stock, and does not take account of your objectives, or your financial situation. We aim to bring you long-term focused analysis driven by fundamental data. Note that our analysis may not factor in the latest price-sensitive company announcements or qualitative material. Simply Wall St has no position in any stocks mentioned.
Have feedback on this article? Concerned about the content? Get in touch with us directly. Alternatively, email editorial-team@simplywallst.com