
With Treasury yields sitting in the 4 to 5% range and cash suddenly paying real income again, investors are quietly rethinking how much risk they want to hold in long-duration growth stories. That reset creates an opening for high-quality dividend stocks in defensive sectors that still trade on reasonable valuations and throw off steady cash. This article examines three such opportunities from our value-and-income screener that appear well placed against the current rate backdrop.
The stocks highlighted below are just a small sample, and the same filters surfaced 20 more U.S. large caps with similarly compelling dividend, valuation, and risk profiles that are not included in this article. If you want to identify and analyze potential high-conviction ideas for your own watchlist, head straight into the High-Quality Dividend-Paying Value Stocks in Defensive Sectors screener.
Verizon Communications (VZ)
Overview: Verizon Communications is a large U.S. telecom that provides wireless, broadband and related connectivity services to consumers, businesses and government customers, which fits the screener’s focus on mature, dividend paying, defensive operators.
Operations: Verizon generates most of its revenue in the United States, led by the Consumer segment at about US$107.2b and Business at about US$29.4b.
Market Cap: US$190.2b
Verizon Communications matters for this dividend and value screen because it offers essential connectivity, a mature cash engine and a relatively defensive profile in a market adjusting to higher yields.
"The rapid expansion of fixed wireless access and fiber broadband, now supported by Verizon Communications being on track for more than 32 million fiber passings by the end of 2026 and a medium term target of 40 million to 50 million passings, together with broadband net adds and the Frontier integration, supports further connectivity share gains that can lift service revenue and ARPU."
The real swing factor is how one pressure on Verizon Communications pricing power interacts with cost discipline to shape future margin resilience.
That pricing pressure is only half the story, and the full narrative for Verizon Communications explains how Verizon Communications could still turn its cash engine into an accelerating income compounder.

Artesian Resources (ARTN.A)
Overview: Artesian Resources is a regulated water and wastewater utility serving residential, commercial, and public customers in Delaware, Maryland, and Pennsylvania. This fits the screener’s focus on essential, cash-generative services that can support dividend payments through different interest rate cycles.
Operations: Artesian Resources generates about US$109 million from its regulated utility activities and about US$8 million from other services, entirely within the United States.
Market Cap: US$347 million
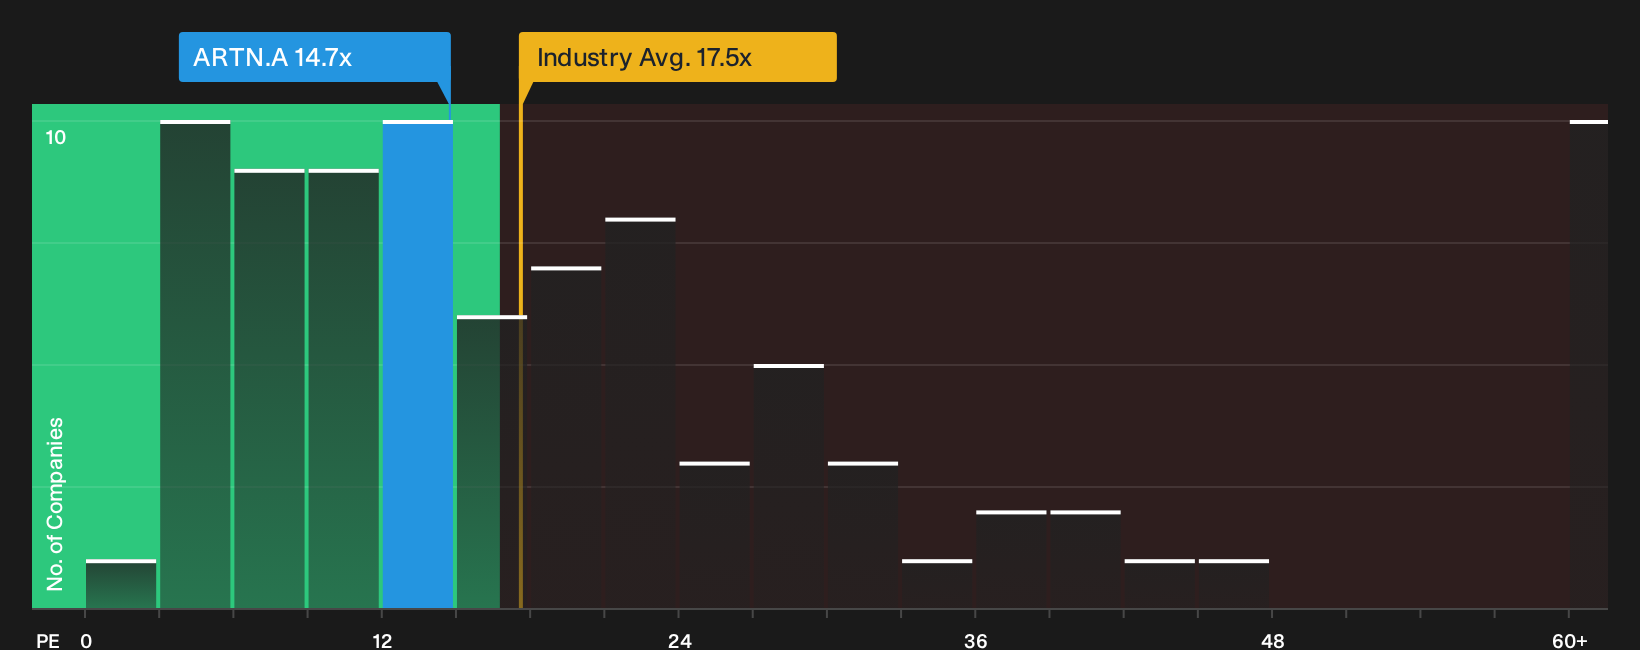
Artesian Resources provides defensive utility exposure, with a 3.82% yield, regulated cash flows, and a P/E of 14.7x that sits below both the global and peer water-utility averages. However, the appeal of that combination still hinges on how its dividend interacts with debt and free cash flow over time.
That trade off is exactly what the Artesian Resources financial health report unpacks, helping you see how Artesian Resources balances its payout ambitions against leverage and cash generation inflection points
MGE Energy (MGEE)
Overview: MGE Energy is a Madison based utility holding company that supplies regulated electricity and natural gas services to customers in Wisconsin.
Operations: MGE Energy generates about US$540 million from electric service, US$252 million from gas, and US$46 million from non regulated energy, all in the United States.
Market Cap: US$2.7b
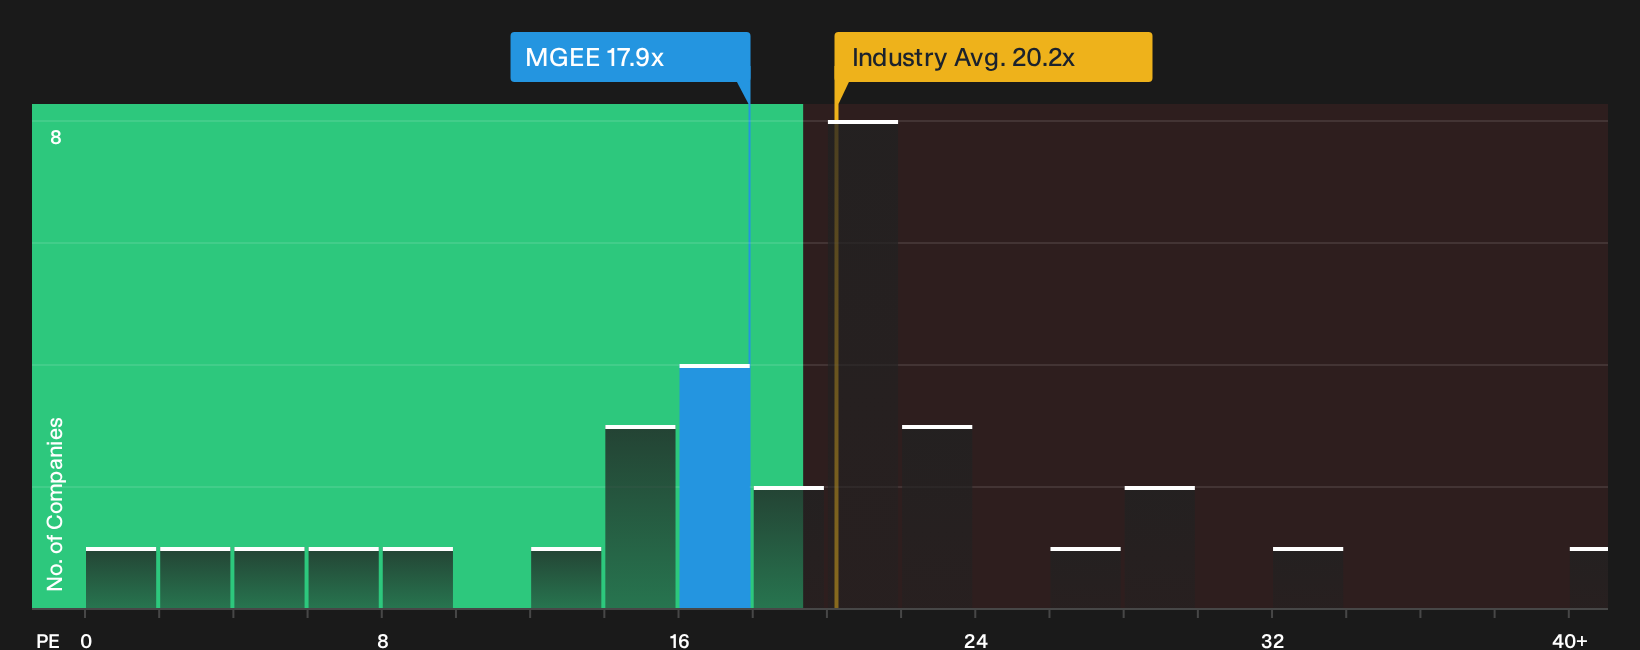
MGE Energy fits this defensive dividend screen as a regulated utility with a 2.69% yield, a P/E of 17.9x below sector averages, and more than fifty consecutive years of payout increases. These payouts are currently supported by rising earnings, careful leverage covenants, and consideration of the potential impact if an unforeseen funding pressure were to tighten more than anticipated.
If you want to see how those earnings, leverage covenants and funding risks stack up in one place, pull up the MGE Energy financial health report for the full picture MGE Energy investors watch closest.
Seeking Fresh Alternatives Beyond Dividends?
Fresh opportunities move first. Breakout themes gain momentum, laggards get caught dropping, and under the radar for now ideas rarely stay quiet for long, so getting in early can be important.
- Target potential trend shifts by scanning 27 high quality undervalued stocks that combine solid balance sheets with cash flows investors may not be fully pricing in yet.
- Consider long term infrastructure momentum through the 43 power grid technology and infrastructure stocks focused on companies tied to grid upgrades, transmission build outs, and critical electrical hardware.
- Track under the radar automation momentum inside the curated 91 robotics and automation stocks with businesses building sensors, controllers, and intelligent machines across factories and warehouses.
This article by Simply Wall St is general in nature. We provide commentary based on historical data and analyst forecasts only using an unbiased methodology and our articles are not intended to be financial advice. It does not constitute a recommendation to buy or sell any stock, and does not take account of your objectives, or your financial situation. We aim to bring you long-term focused analysis driven by fundamental data. Note that our analysis may not factor in the latest price-sensitive company announcements or qualitative material. Simply Wall St has no position in any stocks mentioned.
Have feedback on this article? Concerned about the content? Get in touch with us directly. Alternatively, email editorial-team@simplywallst.com