
W.W. Grainger (GWW) has drawn attention after the stock declined about 5% over the past month and roughly 8% over the past 3 months, despite solid trailing multi year total returns.
Short term momentum for W.W. Grainger has cooled, with the share price down 2.84% over the last day and 4.84% over the past month, while the year to date share price return of 23.84% and 1 year total shareholder return of 30.59% still indicate a strong multi year run that may now be facing some profit taking or a reassessment of risk.
Scan how W.W. Grainger compares with other resilient industrials by reviewing the hand picked list of solid balance sheet and fundamentals (24 results).
After that pullback in W.W. Grainger, investors are essentially paying a premium for a company with strong trailing returns and steady reported growth. The key question is whether the current price still offers enough potential upside to justify the risk.
Most Popular Narrative: 6.7% Undervalued
Against W.W. Grainger's last close at $1,243.07, the most followed narrative pegs fair value near $1,333, which frames the recent pullback as a valuation gap rather than a complete reset.
Grainger's increasing mix of private label products and ongoing investment in supply chain automation are supporting margin expansion and higher long-term free cash flow conversion, helping offset transitory gross margin headwinds from LIFO/tariff impacts. Persistent strong free cash flow generation enables steady shareholder returns via dividends and buybacks, sustaining long-term EPS growth even through periods of near-term inventory/pricing-related accounting volatility.
See why 27 investors see W.W. Grainger as 7% undervalued.
Result: Fair Value of $1,333 (UNDERVALUED)
Still, a softer than expected MRO demand backdrop and ongoing tariff related cost pressure could challenge the W.W. Grainger margin narrative that investors are leaning on.
Find out about the key risks to this W.W. Grainger narrative.
Another View on W.W. Grainger’s Valuation
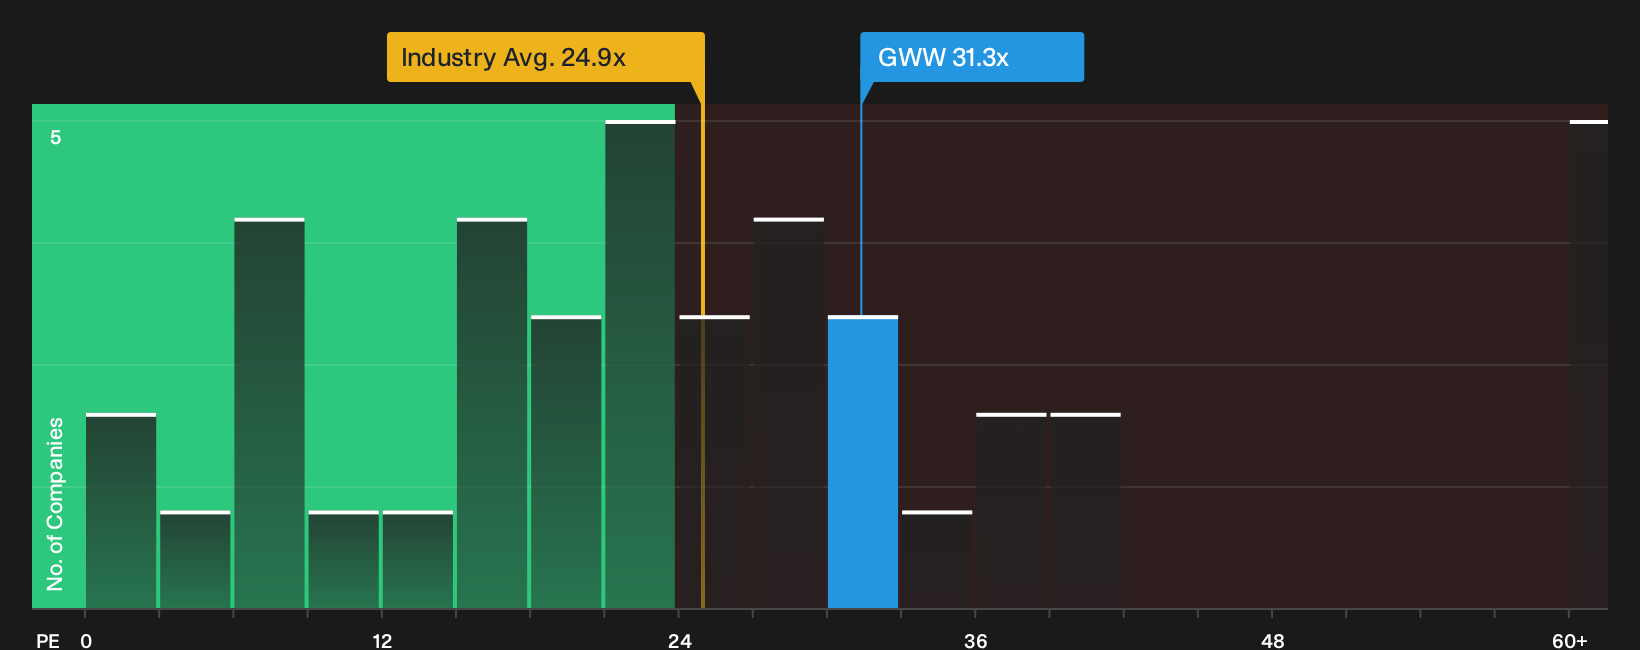
The narrative fair value for W.W. Grainger sits near $1,333, but the current P/E of 31.3x tells a different story. That multiple is higher than both the US Trade Distributors industry at 24.9x and an estimated fair ratio of 26.3x, which suggests investors are paying up and shrinking the margin for error. Which signal do you trust when the story and the multiple are out of sync?
For a closer look at what this richer earnings multiple could imply for valuation risk, See what the numbers say about this price — find out in our valuation breakdown.
Next Steps
Mixed signals around W.W. Grainger can easily sway sentiment, so move quickly, review the full data set, and weigh both sides of the story. To see the balance of potential upsides and the key issues that could hold the shares back, start with this clear snapshot of 1 key reward and 1 important warning sign.
Looking for more W.W. Grainger sized investment ideas?
Do not stop with W.W. Grainger. Use the Simply Wall St screener to surface fresh opportunities that fit the kind of portfolio you actually want to build.
- Target resilient compounding potential by reviewing a curated set of 16 high quality undiscovered gems that pair solid fundamentals with room for broader market attention.
- Anchor your portfolio in quality by weighing a list of solid balance sheet and fundamentals (24 results) that can better handle shocks when conditions get rough.
- Hunt for value with discipline by scanning a focused group of 32 high quality undervalued stocks before momentum returns and the easy mispricing closes.
This article by Simply Wall St is general in nature. We provide commentary based on historical data and analyst forecasts only using an unbiased methodology and our articles are not intended to be financial advice. It does not constitute a recommendation to buy or sell any stock, and does not take account of your objectives, or your financial situation. We aim to bring you long-term focused analysis driven by fundamental data. Note that our analysis may not factor in the latest price-sensitive company announcements or qualitative material. Simply Wall St has no position in any stocks mentioned.
Have feedback on this article? Concerned about the content? Get in touch with us directly. Alternatively, email editorial-team@simplywallst.com