
Archrock has delivered a very large 5 year return, yet the current valuation checks send a more cautious signal as the Discounted Cash Flow (DCF) intrinsic value estimate sits at a premium to the share price while earnings based multiples look closer to fair.
- Over 5 years the stock has returned about 4.16x your original investment. This raises the question of how much of Archrock's potential is already reflected in the current price.
- Long term demand expectations for natural gas compression linked to LNG exports and power generation can support higher cash flow assumptions. Any slowdown in these projects or delays in new contracts may pressure the outlook that underpins today's valuation.
- The broader valuation checks point to a mixed picture rather than a clear bargain or clear overvaluation, with Archrock scoring a 4 out of 6 on value.
The issue now is whether Archrock's current price already reflects those cash flow expectations or if there is still room for investors to be compensated for the risks involved.
Compare Archrock's run and valuation signals with other cash flow focused opportunities by scanning our hand picked 51 high quality undervalued stocks.
Does Archrock Look Pricey on Cash Flow?
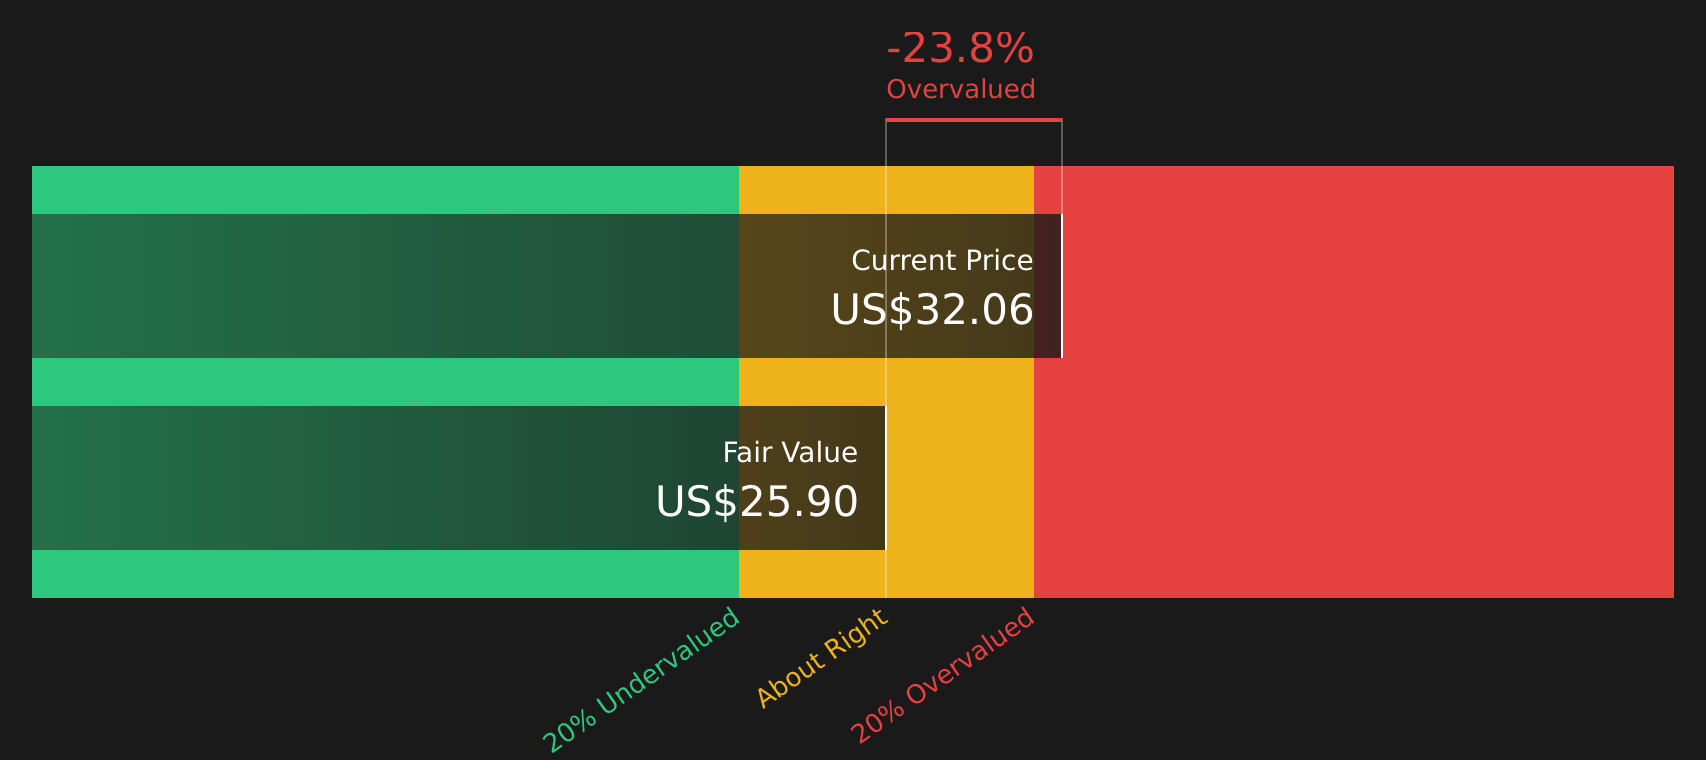
The Discounted Cash Flow (DCF) model values Archrock by projecting future free cash flows and discounting them back to today. For Archrock, the latest twelve month free cash flow is about $269.5 million, and the 2 Stage Free Cash Flow to Equity model assumes cash flows that generally soften over time rather than aggressively grow. On those inputs, the DCF model points to an estimated intrinsic value of about $25.76 per share.
Based on the pre calculated discount, that intrinsic value implies the stock is about 22.9% overvalued relative to the current share price. Recent commentary highlighting stronger long term compression demand linked to LNG exports and power generation helps explain why investors may be willing to pay a premium to the cash flow estimate.
On this DCF view, Archrock stock currently screens as overvalued, with the price sitting above the model’s intrinsic value estimate.
Our Discounted Cash Flow (DCF) analysis suggests Archrock may be overvalued by 22.9%. Discover 51 high quality undervalued stocks or create your own screener to find better value opportunities.
Where Does Archrock Sit on Earnings?
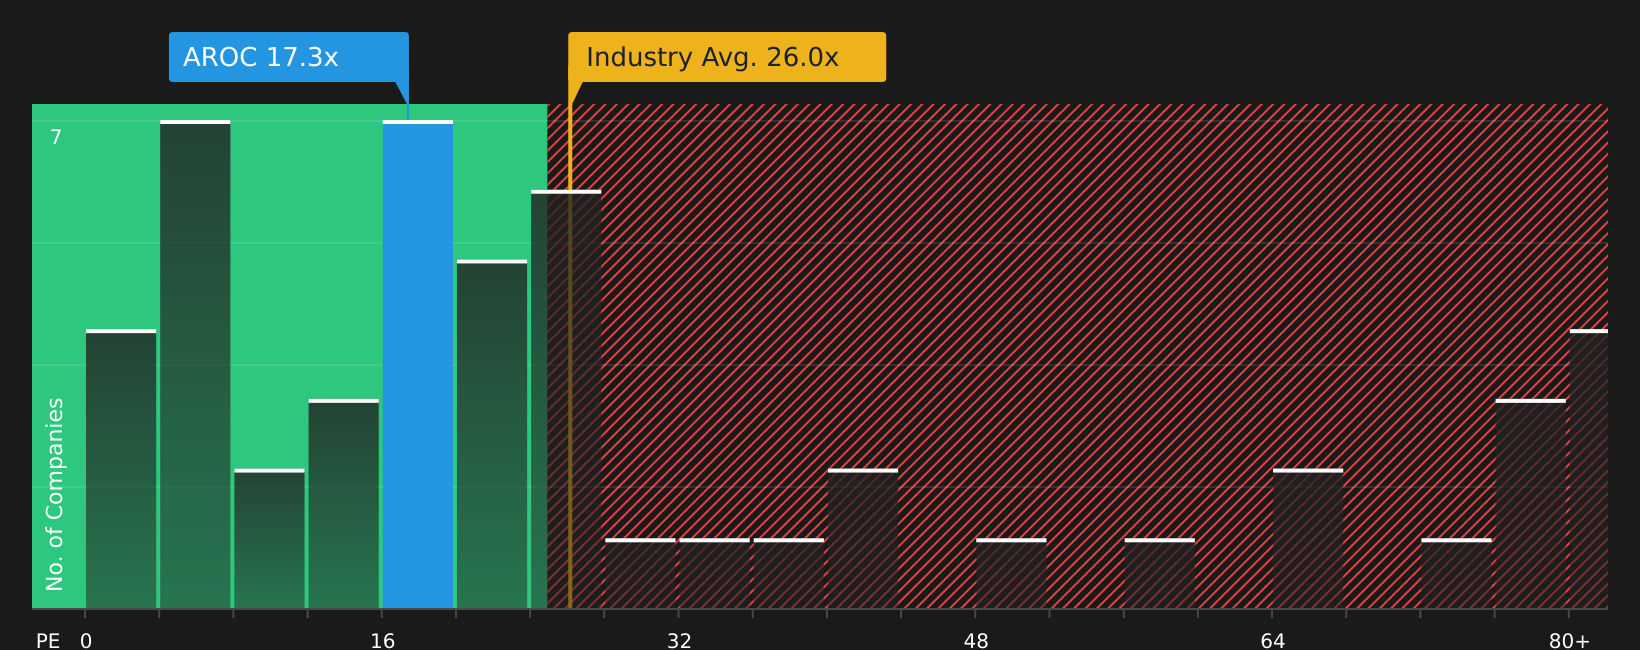
The P/E ratio is a useful way to look at Archrock because earnings are a key driver for how investors typically value established energy services stocks. Archrock currently trades on a P/E of about 17.1x. That is below the broader Energy Services industry average of roughly 25.3x and also under the peer group average of about 41.7x, so the stock does not look stretched against those simple benchmarks.
A more tailored fair P/E for Archrock, which accounts for its size, margins and risk profile, is estimated at around 18.3x. That is only slightly above the current multiple. This suggests the market price is broadly in line with what this framework implies based on the company’s earnings power. In other words, Archrock appears to be trading close to what the model views as a reasonable earnings-based valuation rather than a clear discount or premium.
Overall, Archrock stock looks roughly fairly valued on its current P/E multiple.
See what the numbers say about this price — find out in our valuation breakdown.
The Archrock Narrative: What Would Justify Today's Price?
Simply Wall St Narratives pick up where this valuation puzzle for Archrock leaves off and spell out the specific growth, margin and earnings paths that would need to hold for the stock to be worth significantly more or less than it is today on the market. Rather than focusing on a single multiple or model, each Narrative lays out the assumptions that sit behind its view of fair value so you can compare those inputs with Archrock's actual results as they are reported over time. Narratives are available on Simply Wall St's Community page.
One of the top community narratives on Archrock: 29% undervalued
"Archrock, Inc. (NYSE: AROC), a leading outsourced natural gas compression service provider in the United States, has built a unique moat to meet this structural demand with its 4.5 million horsepower (HP) capacity, electric motor drive (EMD) vision, and strategic acquisitions."
Read one of the top narratives on Archrock
Do you think there's more to the story for Archrock? Head over to our Community to see what others are saying!
The Bottom Line
For Archrock, the Discounted Cash Flow (DCF) work points to an intrinsic value that sits above the current share price, while the P/E framework suggests the stock is priced about right relative to its earnings power. That gap likely reflects how much weight you put on long term cash flow visibility versus today’s earnings and where sentiment has moved after a very strong five year run. With the broader checks looking mixed, the key question from here is whether cash flows linked to natural gas compression projects materialise as expected or whether any slowdown shows that the current pricing already captures most of that story.
This article by Simply Wall St is general in nature. We provide commentary based on historical data and analyst forecasts only using an unbiased methodology and our articles are not intended to be financial advice. It does not constitute a recommendation to buy or sell any stock, and does not take account of your objectives, or your financial situation. We aim to bring you long-term focused analysis driven by fundamental data. Note that our analysis may not factor in the latest price-sensitive company announcements or qualitative material. Simply Wall St has no position in any stocks mentioned.
Have feedback on this article? Concerned about the content? Get in touch with us directly. Alternatively, email editorial-team@simplywallst.com