
Cognex (CGNX) stock has drawn attention after recent price moves, with shares last closing at US$59.82. Investors are weighing this level in relation to the company’s recent return profile and its underlying machine vision business.
Recent trading has been choppy for Cognex, with a 1-day share price return of 2.19% at US$59.82 contrasting with a 7-day share price return that is down 5.66% and a 90-day share price return that is down 10.31%. However, the year-to-date share price return of 61.98% and 1-year total shareholder return of 37.18% suggest earlier momentum has cooled rather than reversed completely.
Compare Cognex's recent swings with a hand picked group of automation and machine vision peers in the 38 robotics and automation stocks to see how other robotics exposed stocks are trading right now.
After a strong run earlier in the year and a recent pullback, Cognex now trades roughly 34% below the average analyst price target near US$80. Does that gap signal that market caution is excessive, or is it justified by fundamentals?
Most Popular Narrative: 25.6% Undervalued
Using the most followed narrative, Cognex's fair value sits at $80.42 compared with the latest close at $59.82. That gap rests on a detailed long term earnings and margin story built over several explicit assumptions and a specific discount rate of 8.89%.
Ongoing investments in R&D and a robust technology roadmap (including deeper AI integration and product ecosystem expansion) enhance Cognex's technology leadership, which underpins pricing power and sustained earnings growth.
Want to see what that roadmap means in numbers? This narrative leans on a steady revenue build, rising profitability, and a richer earnings multiple. Curious how those pieces combine into an $80.42 fair value and why the discount rate matters so much here? The full breakdown connects each assumption directly to that target.
Result: Fair Value of $80.42 (UNDERVALUED)
Have a read of the narrative in full and understand what's behind the forecasts.
However, investors still need to weigh risks such as pricing pressure in commoditizing hardware and potential delays in Cognex shifting customers to higher margin AI software.
Find out about the key risks to this Cognex narrative.
Another View on Cognex Using Market Ratios
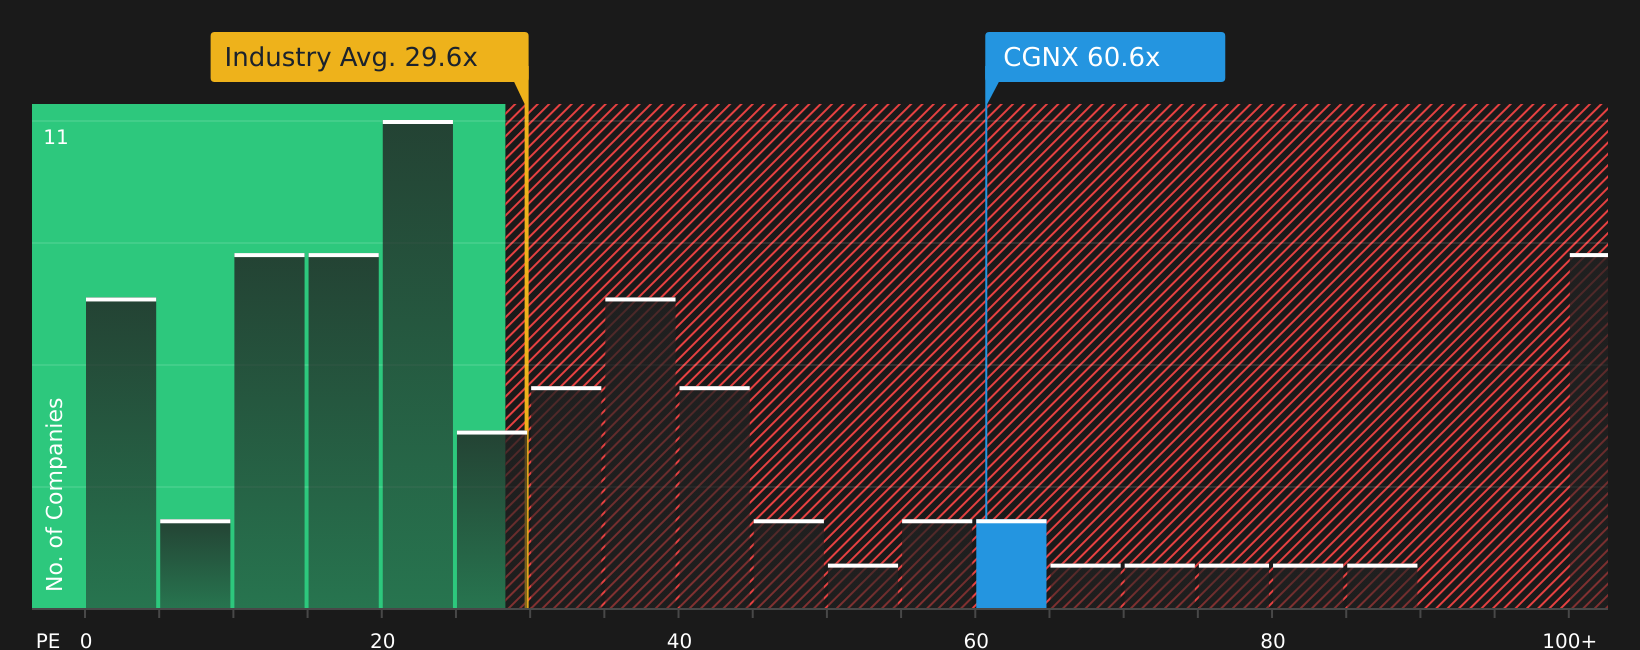
The narrative fair value suggests Cognex is 25.6% undervalued at $59.82. Yet on simple earnings ratios the picture is very different. Cognex trades on a P/E of 57.6x versus a fair ratio estimate of 33.4x, a peer average of 45.7x and a US Electronic industry average of 30x. That gap points to meaningful valuation risk if sentiment normalizes. How comfortable are you with paying a premium this large for the current growth profile?
See what the numbers say about this price — find out in our valuation breakdown.
Next Steps
With sentiment on Cognex split between valuation risk and upside potential, it makes sense to move quickly and test the numbers yourself before opinion hardens. To see what the current optimism is built on in practical terms, review the 3 key rewards.
Looking for more investment ideas beyond Cognex?
If Cognex has your attention, do not stop there. Broaden your watchlist now and give yourself more options before the next big move happens.
- Target rock solid balance sheets and steady fundamentals by scanning the list of solid balance sheet and fundamentals (51 results) that could help anchor your portfolio.
- Hunt for potential mispricings by checking the 49 high quality undervalued stocks that combine quality metrics with attractive valuations.
- Spot opportunities off the beaten path by reviewing the 18 high quality undiscovered gems before other investors start paying attention.
This article by Simply Wall St is general in nature. We provide commentary based on historical data and analyst forecasts only using an unbiased methodology and our articles are not intended to be financial advice. It does not constitute a recommendation to buy or sell any stock, and does not take account of your objectives, or your financial situation. We aim to bring you long-term focused analysis driven by fundamental data. Note that our analysis may not factor in the latest price-sensitive company announcements or qualitative material. Simply Wall St has no position in any stocks mentioned.
Have feedback on this article? Concerned about the content? Get in touch with us directly. Alternatively, email editorial-team@simplywallst.com