
RTX Corporation (RTX) was recently dropped from the Russell 1000 Dynamic Index, a shift that may affect how certain index-linked funds treat the stock and how investors think about its role in diversified portfolios.
See our latest analysis for RTX.
RTX has attracted attention recently with a 3.90% 1 day share price return to US$199.25 and a 30 day share price return of 11.06%. A 1 year total shareholder return of 38.89% alongside a 5 year total shareholder return of 157.50% signals longer term momentum that contrasts with shorter term index changes and fresh contract and dividend announcements.
If RTX's recent moves have you reassessing the defense and aerospace space, it could be a good moment to see what else is trending through 29 robotics and automation stocks
With RTX trading near US$199.25 after strong 1 year gains, recent contract wins, a US$0.73 dividend and forecasts of single digit earnings growth, the key question is whether RTX is still attractively priced or if the market is already pricing in future growth.
Most Popular Narrative: 8% Undervalued
RTX's most followed valuation narrative places fair value around $216 per share, slightly above the recent close near $199, setting up a modest perceived upside driven by contract momentum and earnings execution.
Robust and growing backlog, highlighted by a 1.86 quarter book-to-bill ratio, $236 billion backlog (up 15% year-over-year), and major new international contracts (e.g., EU, MENA, Asia-Pacific) indicate RTX is well-positioned to benefit from sustained increases in global defense spending and heightened geopolitical tensions, setting up strong visibility for future revenue growth.
Read the complete narrative. Read the complete narrative.
Want to see what is behind that fair value for RTX? The narrative leans heavily on steadily rising revenue, firmer margins and a richer profit multiple than many investors might expect. Curious which specific growth and profitability assumptions have been baked in, and how they tie back to that backlog story and analyst discount rate?
Result: Fair Value of $215.73 (UNDERVALUED)
Have a read of the narrative in full and understand what's behind the forecasts.
However, RTX's reliance on government defense budgets, along with ongoing jet engine reliability and cost risks, could quickly challenge that upside narrative if contracts or costs move against expectations.
Find out about the key risks to this RTX narrative.
Another View: RTX Through a Cash Flow Lens
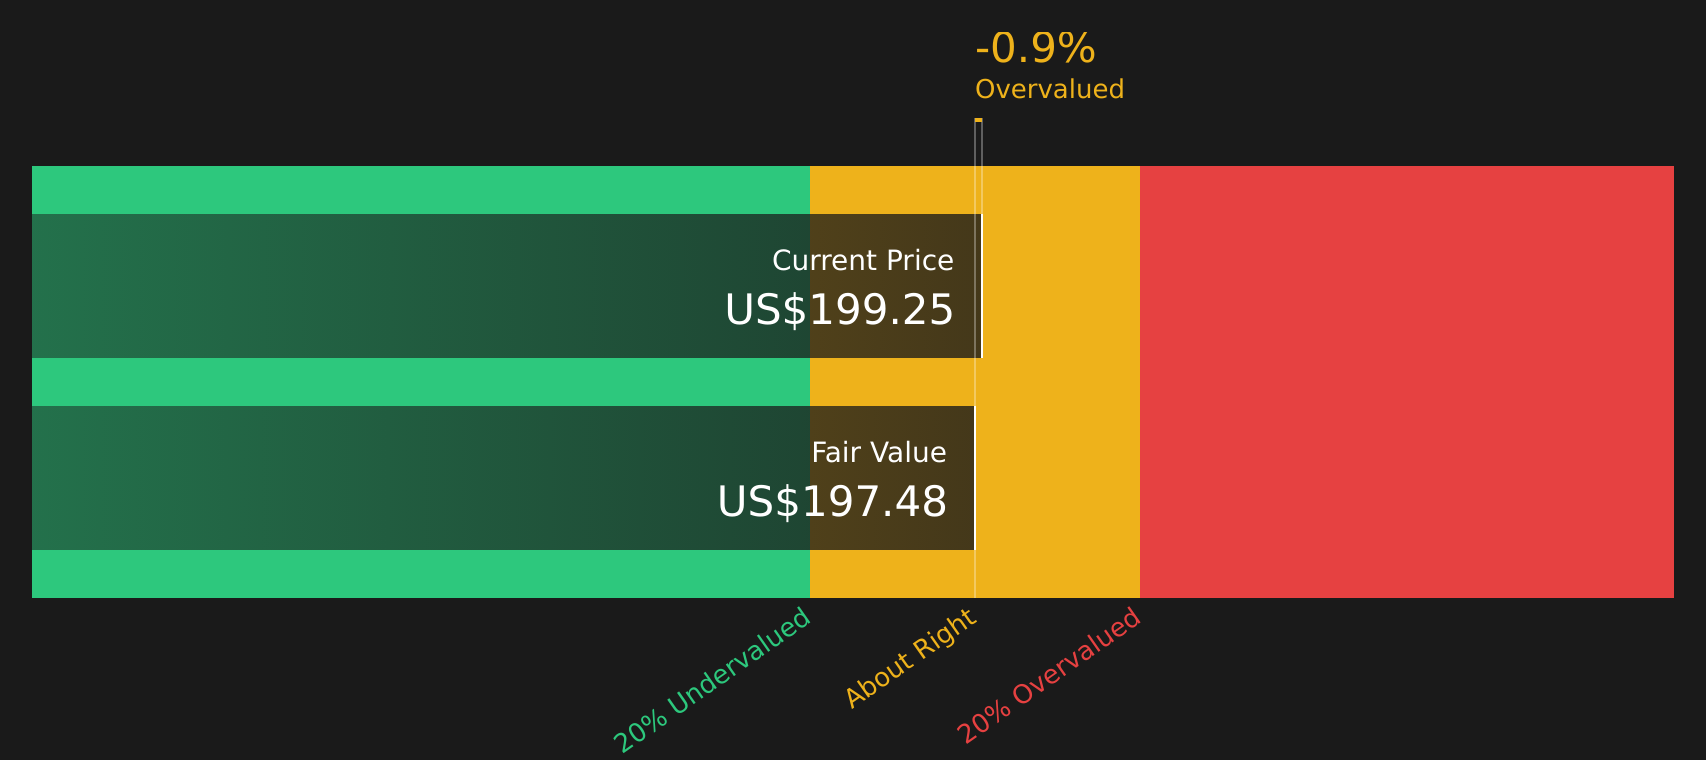
While RTX looks modestly undervalued against analyst fair value estimates around US$215.73, the Simply Wall St DCF model tells a tighter story. On that basis, RTX at US$199.25 is trading slightly above an estimated future cash flow value of about US$197.48, which points to less clear-cut upside.
For investors who lean on cash flow based work, this kind of small gap can feel more like a reminder to stress test assumptions than a green or red light. How much weight do you want to give earnings multiples versus cash flow today?
Look into how the SWS DCF model arrives at its fair value.
Simply Wall St performs a discounted cash flow (DCF) on every stock in the world every day (check out RTX for example). We show the entire calculation in full. You can track the result in your watchlist or portfolio and be alerted when this changes, or use our stock screener to discover 44 high quality undervalued stocks. If you save a screener we even alert you when new companies match - so you never miss a potential opportunity.
Next Steps
Seeing both optimism and caution around RTX in this article, it makes sense to review the underlying metrics yourself and decide how the trade off between risks and rewards fits your goals. You can start with the 4 key rewards and 2 important warning signs.
Looking for more RTX investment ideas?
If RTX has sharpened your interest in new opportunities, do not stop here. Broaden your watchlist with other ideas that could fit different roles in your portfolio.
- Target stability with companies that prioritize financial strength and lower risk, starting with the 74 resilient stocks with low risk scores.
- Hunt for value by focusing on quality businesses that trade below their estimated worth through the 44 high quality undervalued stocks.
- Strengthen your income stream by reviewing companies offering higher yields via the 7 dividend fortresses.
This article by Simply Wall St is general in nature. We provide commentary based on historical data and analyst forecasts only using an unbiased methodology and our articles are not intended to be financial advice. It does not constitute a recommendation to buy or sell any stock, and does not take account of your objectives, or your financial situation. We aim to bring you long-term focused analysis driven by fundamental data. Note that our analysis may not factor in the latest price-sensitive company announcements or qualitative material. Simply Wall St has no position in any stocks mentioned.
Have feedback on this article? Concerned about the content? Get in touch with us directly. Alternatively, email editorial-team@simplywallst.com