
- Textron Inc. was removed from the Russell 1000 Dynamic Index on 27 June 2026, a change that can affect how index-tracking funds hold the stock.
- This index removal may alter the mix of institutional ownership in Textron, potentially influencing future liquidity and investor attention to the company.
- We’ll now examine how Textron’s removal from the Russell 1000 Dynamic Index may influence the company’s wider investment narrative and outlook.
Capitalize on the AI infrastructure supercycle with our selection of the 51 best 'picks and shovels' of the AI gold rush converting record-breaking demand into massive cash flow.
Textron Investment Narrative Recap
To own Textron, you need to believe in its core aerospace and defense franchises, improving margins and the planned separation of the Industrial segment. The removal from the Russell 1000 Dynamic Index is more about how certain funds hold the stock than about fundamentals, so it does not materially change the near term catalysts around the Denali engine certification or the key risk of margin pressure from weak mix and cost inflation.
The most relevant recent announcement here is Textron’s plan to separate its Industrial segment, creating a focused aerospace and defense company with over US$12,000,000,000 in projected 2026 revenue. That pending split could be far more important for Textron’s trading profile and investor base than a single index change, especially if it sharpens attention on aviation and Bell’s execution while leaving the more cyclical Industrial operations to stand on their own.
Yet against that backdrop, investors should still watch how any shift in institutional ownership could interact with Textron’s exposure to tariffs and geopolitical risks...
Read the full narrative on Textron (it's free!)
Textron's narrative projects $16.7 billion revenue and $1.2 billion earnings by 2029. This requires 3.2% yearly revenue growth and an earnings increase of about $0.3 billion from $936.0 million today.
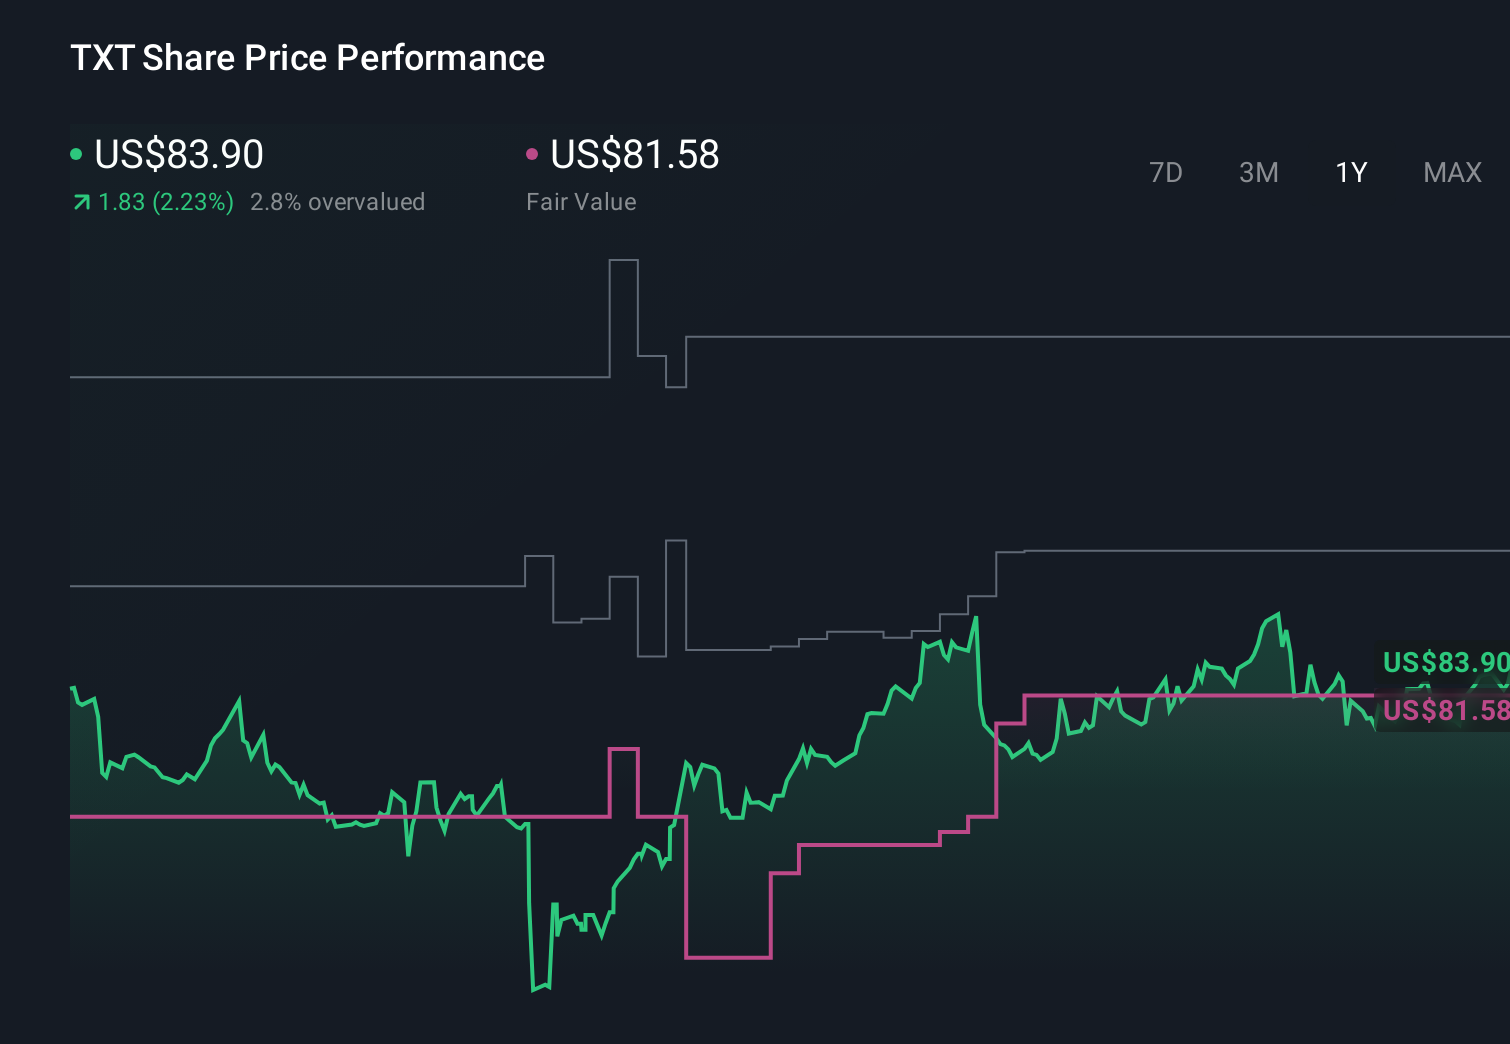
Uncover how Textron's forecasts yield a $103.45 fair value, a 13% upside to its current price.
Exploring Other Perspectives
Some of the most optimistic analysts were modeling US$17,800,000,000 of revenue and US$1,300,000,000 of earnings by 2029, which contrasts sharply with concerns about overreliance on U.S. defense contracts, reminding you that informed views can differ widely and that this index change could still reshape how both optimistic and cautious narratives evolve.
Explore 4 other fair value estimates on Textron - why the stock might be worth just $90.00!
Decide For Yourself
Disagree with existing narratives? Extraordinary investment returns rarely come from following the herd, so go with your instincts.
- A great starting point for your Textron research is our analysis highlighting 4 key rewards that could impact your investment decision.
- Our free Textron research report provides a comprehensive fundamental analysis summarized in a single visual - the Snowflake - making it easy to evaluate Textron's overall financial health at a glance.
Ready To Venture Into Other Investment Styles?
Right now could be the best entry point. These picks are fresh from our daily scans. Don't delay:
- The latest GPUs need a type of rare earth metal called Terbium and there are only 31 companies in the world exploring or producing it. Find the list for free.
- The future of work is here. Discover the 29 top robotics and automation stocks leading the charge in AI-driven automation and industrial transformation.
- This technology could replace computers: discover 26 stocks that are working to make quantum computing a reality.
This article by Simply Wall St is general in nature. We provide commentary based on historical data and analyst forecasts only using an unbiased methodology and our articles are not intended to be financial advice. It does not constitute a recommendation to buy or sell any stock, and does not take account of your objectives, or your financial situation. We aim to bring you long-term focused analysis driven by fundamental data. Note that our analysis may not factor in the latest price-sensitive company announcements or qualitative material. Simply Wall St has no position in any stocks mentioned.
Have feedback on this article? Concerned about the content? Get in touch with us directly. Alternatively, email editorial-team@simplywallst.com