
- In late June 2026, Jefferies Financial Group Inc. was removed from several Russell growth benchmarks while simultaneously issuing new senior unsecured fixed-rate notes maturing between 2031 and 2046.
- Alongside these index removals, Jefferies reported higher revenue and net income year-on-year, continued share repurchases, and affirmed its quarterly dividend, underscoring a multifaceted capital allocation approach.
- Against this backdrop of Russell index exclusions, we’ll examine how these benchmark changes shape Jefferies Financial Group’s broader investment narrative.
This technology could replace computers: discover 26 stocks that are working to make quantum computing a reality.
What Is Jefferies Financial Group's Investment Narrative?
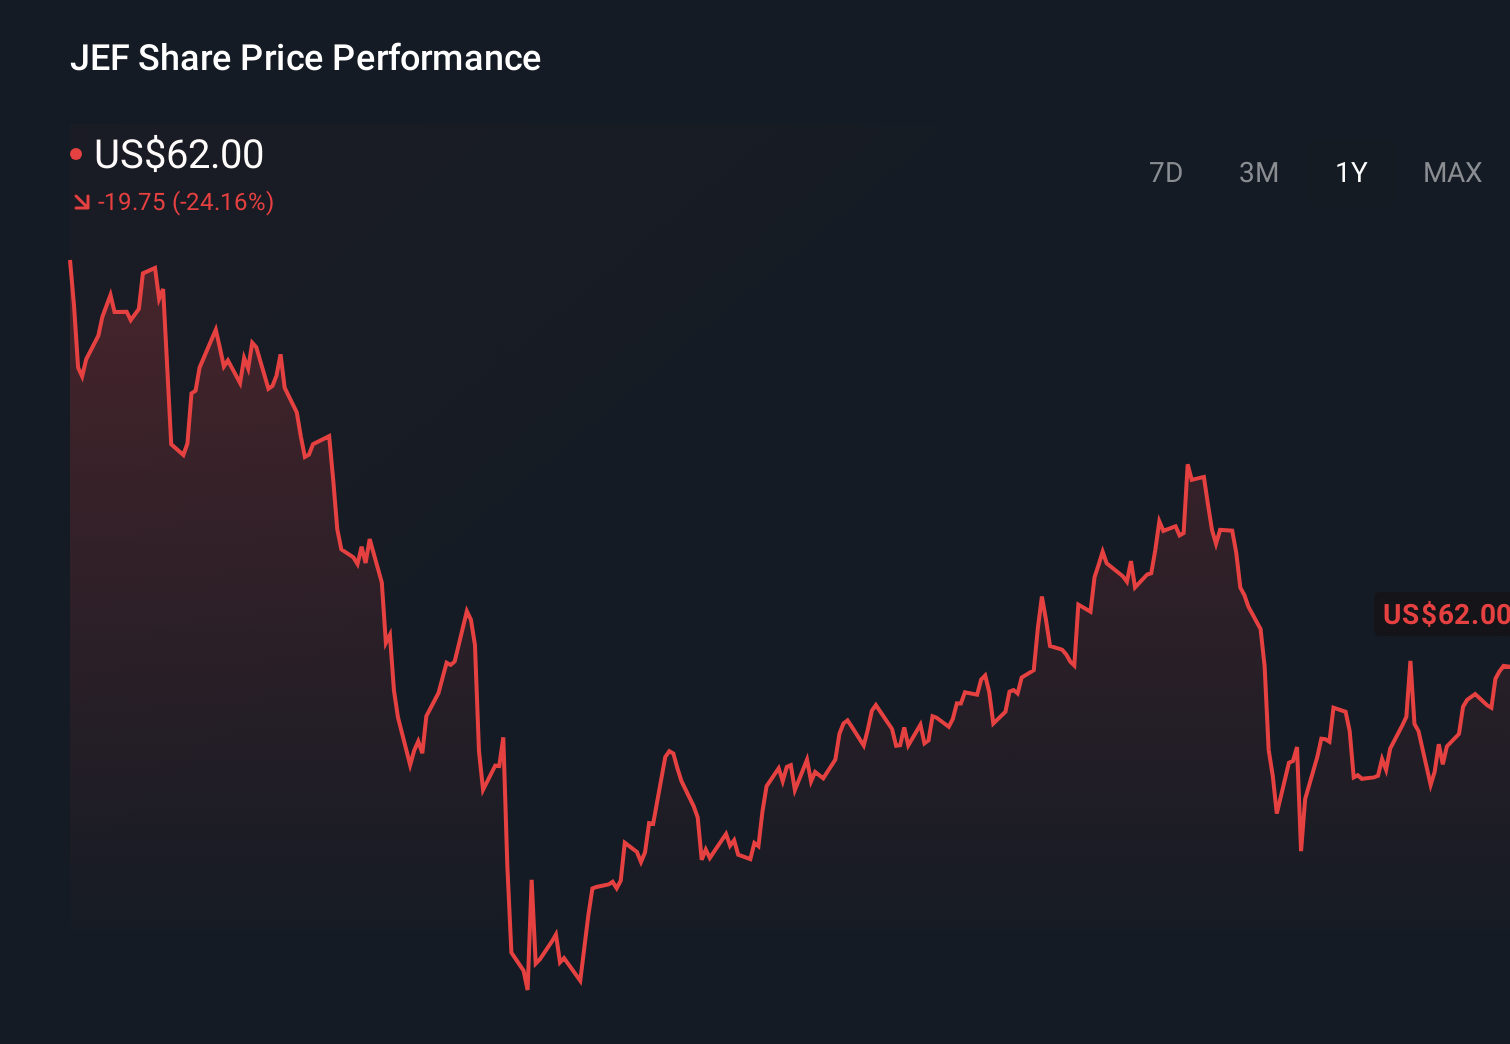
To own Jefferies today, you need to be comfortable with a capital-markets business that mixes deal-driven earnings with shareholder returns through buybacks and dividends, and that now sits outside key Russell growth indices. The recent index removals triggered a sharp share price drop but do not change Jefferies’ underlying revenue and net income profile or its ongoing repurchases and US$0.40 quarterly dividend. The more immediate swing factors still look tied to deal activity, trading conditions and management’s use of the balance sheet, including the new senior unsecured notes out to 2046 that extend funding at fixed coupons. The bigger risks remain earnings volatility, relatively low return on equity and the pressure that higher leverage or prolonged crypto-market uncertainty could put on that investment-banking and trading engine.
However, one key funding and earnings risk here is easy to miss at first glance. Despite retreating, Jefferies Financial Group's shares might still be trading above their fair value and there could be some more downside. Discover how much.Exploring Other Perspectives
Three Simply Wall St Community members currently see Jefferies’ fair value between about US$50 and US$65 per share. Set that against recent index exclusions and fresh long-dated debt issuance, and you can see why different investors might weigh the trade off between funding flexibility and earnings volatility very differently, making it worth comparing several viewpoints before deciding where you stand.
Explore 3 other fair value estimates on Jefferies Financial Group - why the stock might be worth as much as 31% more than the current price!
Reach Your Own Conclusion
Disagree with this assessment? Extraordinary investment returns rarely come from following the herd, so go with your instincts.
- A great starting point for your Jefferies Financial Group research is our analysis highlighting 3 key rewards and 1 important warning sign that could impact your investment decision.
- Our free Jefferies Financial Group research report provides a comprehensive fundamental analysis summarized in a single visual - the Snowflake - making it easy to evaluate Jefferies Financial Group's overall financial health at a glance.
Seeking Other Investments?
Opportunities like this don't last. These are today's most promising picks. Check them out now:
- Outshine the giants: these 15 early-stage AI stocks could fund your retirement.
- Find 43 companies with promising cash flow potential yet trading below their fair value.
- Uncover the next big thing with 22 elite penny stocks that balance risk and reward.
This article by Simply Wall St is general in nature. We provide commentary based on historical data and analyst forecasts only using an unbiased methodology and our articles are not intended to be financial advice. It does not constitute a recommendation to buy or sell any stock, and does not take account of your objectives, or your financial situation. We aim to bring you long-term focused analysis driven by fundamental data. Note that our analysis may not factor in the latest price-sensitive company announcements or qualitative material. Simply Wall St has no position in any stocks mentioned.
Have feedback on this article? Concerned about the content? Get in touch with us directly. Alternatively, email editorial-team@simplywallst.com