
- If you are wondering whether Lennox International at around US$532 per share offers good value or is priced for perfection, the current numbers give you a starting point but not the full story.
- The stock recently closed at US$532.43, with returns of 3.0% over the past week, 10.3% over the past month, 6.7% year to date, and a decline of 1.8% over the last year, compared with 75.2% and 71.0% over the past 3 and 5 years respectively.
- Recent news around Lennox International has focused on its position in capital goods and how investors are reassessing stocks in this sector in light of interest rate expectations and spending patterns. Commentary has also highlighted how past multi year share price strength is being weighed against shorter term moves as investors reassess what they are prepared to pay.
- Lennox International currently has a valuation score of 3 out of 6. The rest of this article will walk through the key valuation methods behind that result and then finish with an approach that can help you put all these valuation signals into a single, clearer picture.
Find out why Lennox International's -1.8% return over the last year is lagging behind its peers.
Approach 1: Lennox International Discounted Cash Flow (DCF) Analysis
A Discounted Cash Flow, or DCF, model estimates what a stock could be worth by projecting the cash the company may generate in the future and discounting those cash flows back to today. For Lennox International, the model used here is a 2 Stage Free Cash Flow to Equity approach, based on cash flow projections.
Lennox International most recently reported trailing twelve month free cash flow of about $623.3 million. Analysts provide free cash flow estimates out to 2026, and Simply Wall St extends these out further, with projected free cash flow of $1,306.0 million in 2030. Each of these future cash flows is discounted back to today using the DCF framework to arrive at an estimated intrinsic value per share.
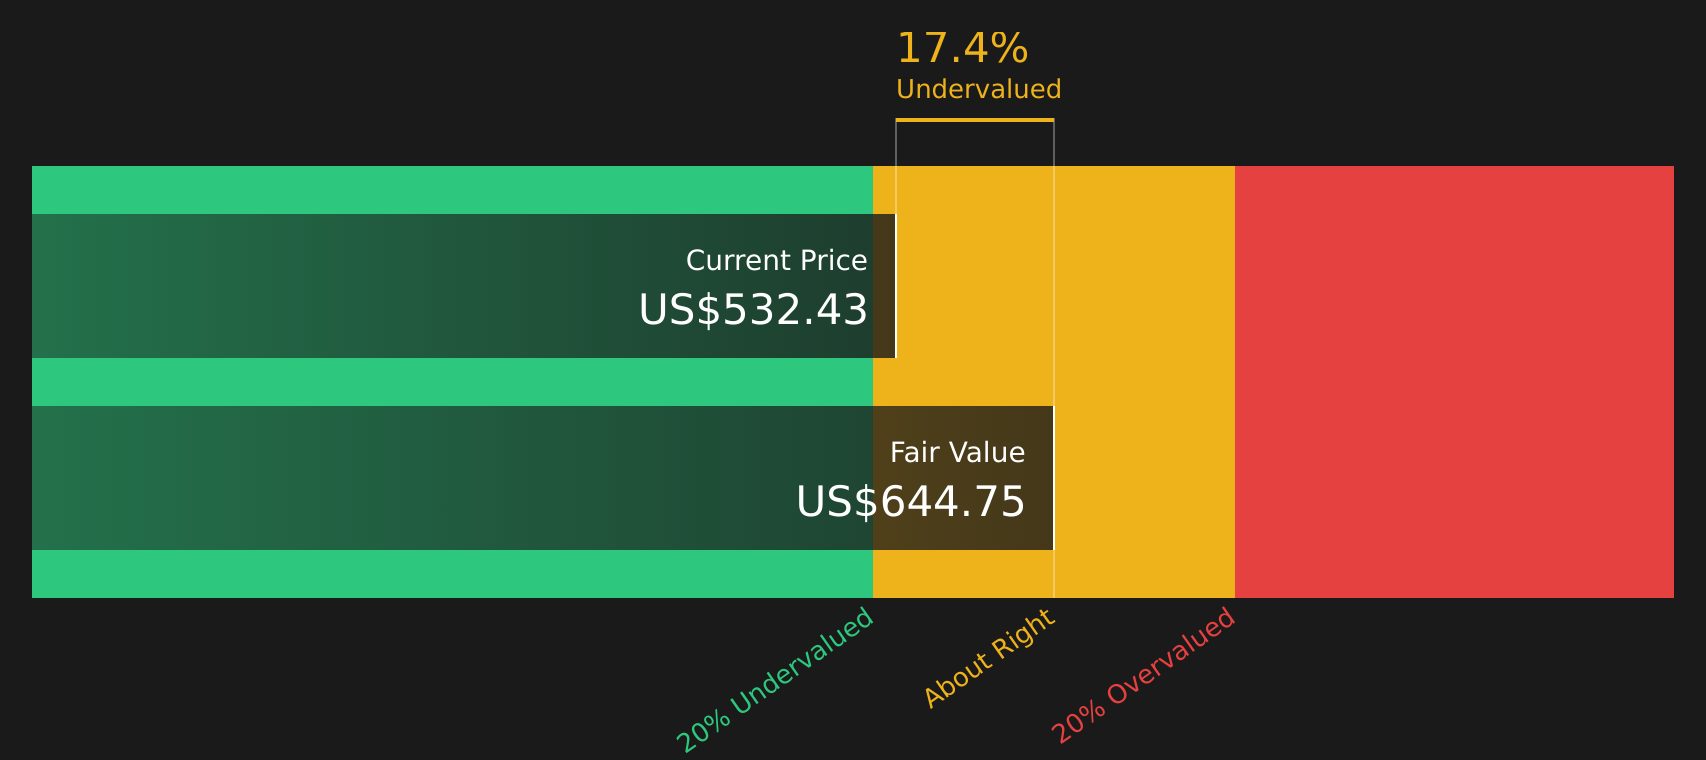
Based on this analysis, the DCF fair value estimate for Lennox International is $644.71 per share, compared with the recent share price of about $532.43. This indicates that, under this cash flow based approach, the stock appears to be around 17.4% undervalued.
Result: UNDERVALUED
Our Discounted Cash Flow (DCF) analysis suggests Lennox International is undervalued by 17.4%. Track this in your watchlist or portfolio, or discover 45 more high quality undervalued stocks.
Approach 2: Lennox International Price vs Earnings
For a profitable company like Lennox International, the P/E ratio is a useful shorthand for what investors are currently willing to pay for each dollar of earnings. A higher or lower P/E often reflects what the market expects for future growth and how much risk investors see in those earnings.
Growth expectations and perceived risk matter because faster, more predictable earnings streams often justify a higher “normal” or “fair” P/E, while slower or more uncertain earnings can support a lower one. That context helps when you compare Lennox International’s current P/E of 23.35x with the Building industry average of 21.13x and a peer group average of 46.25x.
Simply Wall St’s Fair Ratio for Lennox International is 28.22x. This is its proprietary estimate of what the P/E could be given factors such as earnings growth, industry, profit margin, market cap and risk profile. This tailored Fair Ratio can be more informative than a simple comparison with peers or the broader industry because it adjusts for company specific characteristics instead of assuming one size fits all. With a current P/E of 23.35x versus a Fair Ratio of 28.22x, the stock screens as modestly undervalued on this metric.
Result: UNDERVALUED

P/E ratios tell one story, but what if the real opportunity lies elsewhere? Start investing in legacies, not executives. Discover our 20 top founder-led companies.
Upgrade Your Decision Making: Choose your Lennox International Narrative
Earlier it was mentioned that there is an even better way to understand what Lennox International might be worth. This is where Narratives come in, giving you a simple story behind the numbers by linking your view of the company to specific forecasts for revenue, earnings and margins, and then to a fair value that you can compare with the current share price.
On Simply Wall St’s Community page, Narratives are an accessible tool used by millions of investors. They let you pick or adjust a forecast that fits your view, see the implied fair value, and then quickly check whether that fair value is above or below today’s price to help you decide whether the stock looks attractive or stretched on your assumptions.
Because Narratives are refreshed when new information such as earnings reports or news is added, you are not locked into a static model. You can also see how your Lennox International view compares with others, such as a more optimistic Narrative that points to a fair value of about US$650 per share and a more cautious one closer to US$450 per share, both built from different expectations for future growth, margins and P/E.
For Lennox International however we will make it really easy for you with previews of two leading Lennox International Narratives:
🐂 Lennox International Bull Case
Fair value in this bullish narrative: US$650.00 per share.
Gap to that fair value versus the recent US$532.43 price, using the narrative framework, is about 18.1% below the narrative fair value.
Revenue growth assumption in this bullish setup: 10.64% a year.
- The bullish view leans on faster revenue growth from the shift to R-454B products, broader use of digital tools, and contributions from joint ventures with Samsung and Ariston.
- Margin expansion in this narrative is supported by a higher mix of premium products, growing service and data driven revenues, and benefits from a larger direct distribution footprint.
- Buybacks and an assumed future P/E of about 22x in 2029 are key to the higher fair value, with investors asked to judge whether those earnings and margin targets feel reasonable.
🐻 Lennox International Bear Case
Fair value in this cautious narrative: US$450.00 per share.
Gap to that fair value versus the recent US$532.43 price, using the narrative framework, is about 18.3% above the narrative fair value.
Revenue growth assumption in this cautious setup: 4.22% a year.
- The bearish view focuses on slower revenue growth as competition in energy efficient HVAC, higher regulatory and compliance costs, and slower digital adoption put pressure on pricing and margins.
- Greater reliance on the North American market and potentially uneven weather driven demand leave earnings in this narrative more exposed to swings in activity.
- This framework assumes a lower future P/E multiple of about 19x in 2029, even with some margin improvement and buybacks, and uses that to anchor a fair value closer to US$450.
If you want to go beyond these previews and see how your own assumptions stack up against other investors, the full set of Lennox International Narratives on Simply Wall St lets you adjust growth, margins, and valuation to build a view that matches your expectations, then compare it with the community range and analyst inputs.
Do you think there's more to the story for Lennox International? Head over to our Community to see what others are saying!

This article by Simply Wall St is general in nature. We provide commentary based on historical data and analyst forecasts only using an unbiased methodology and our articles are not intended to be financial advice. It does not constitute a recommendation to buy or sell any stock, and does not take account of your objectives, or your financial situation. We aim to bring you long-term focused analysis driven by fundamental data. Note that our analysis may not factor in the latest price-sensitive company announcements or qualitative material. Simply Wall St has no position in any stocks mentioned.
Have feedback on this article? Concerned about the content? Get in touch with us directly. Alternatively, email editorial-team@simplywallst.com