
VeriSign overview and recent share performance
VeriSign (VRSN) has drawn investor attention recently, with the stock roughly flat over the past month, up about 20% in the past 3 months and 18% year to date.
Over the past year, the total return stands at about 3%, while the 3 year and 5 year total returns are approximately 29% and 31%. These figures offer useful context before you look at earnings and valuation.
See our latest analysis for VeriSign.
While the share price is around $283.89 after a modest pullback over the past week, the strong 90 day share price return of 20.43% alongside a more muted 1 year total shareholder return of 3.20% suggests recent momentum has picked up from a softer longer term base, which investors may weigh against earnings quality and valuation.
If you are comparing VeriSign with other opportunities in the broader tech ecosystem, this could be a useful moment to scan 48 AI infrastructure stocks.
So with revenue of US$1.68b, net income of US$840.9m and a share price sitting just below the average analyst target, is VeriSign quietly undervalued right now or is the market already pricing in future growth?
Most Popular Narrative: 72% Overvalued
According to ValueInvestor_2026, the fair value estimate of $165 sits well below the last close at $283.89, setting up a valuation gap driven by governance and concentration risk.
In light of the above, the risk profile for VeriSign extends beyond typical financial or competitive concerns and includes tangible legal and regulatory hazards rooted in internal management conduct and culture. The combination of credible internal complaints, documented evidence, and the willingness of former employees to pursue litigation creates a non-trivial likelihood of material legal actions and adverse disclosures.
Curious how a single core service, slow reported growth and potential legal overhang are combined into one valuation story? The narrative leans on concentrated revenue, potential contract fragility and profit assumptions that all work together to justify a sharply lower fair value. The exact drivers sit inside the full write up.
Result: Fair Value of $165 (OVERVALUED)
Have a read of the narrative in full and understand what's behind the forecasts.
However, this bearish thesis could be challenged if legal concerns fail to materialize into meaningful actions, or if .com and .net contract renewals progress without added scrutiny.
Wall Street's queuing for one rocket. While SpaceX counts down to its IPO, other companies tied to the new space race are already in orbit. → 20 Compelling Space Companies watchlist · Global Space Race Investing Ideas screener · Scan the sector by valuation on Rocket Lab's valuation page.
Another angle on valuation
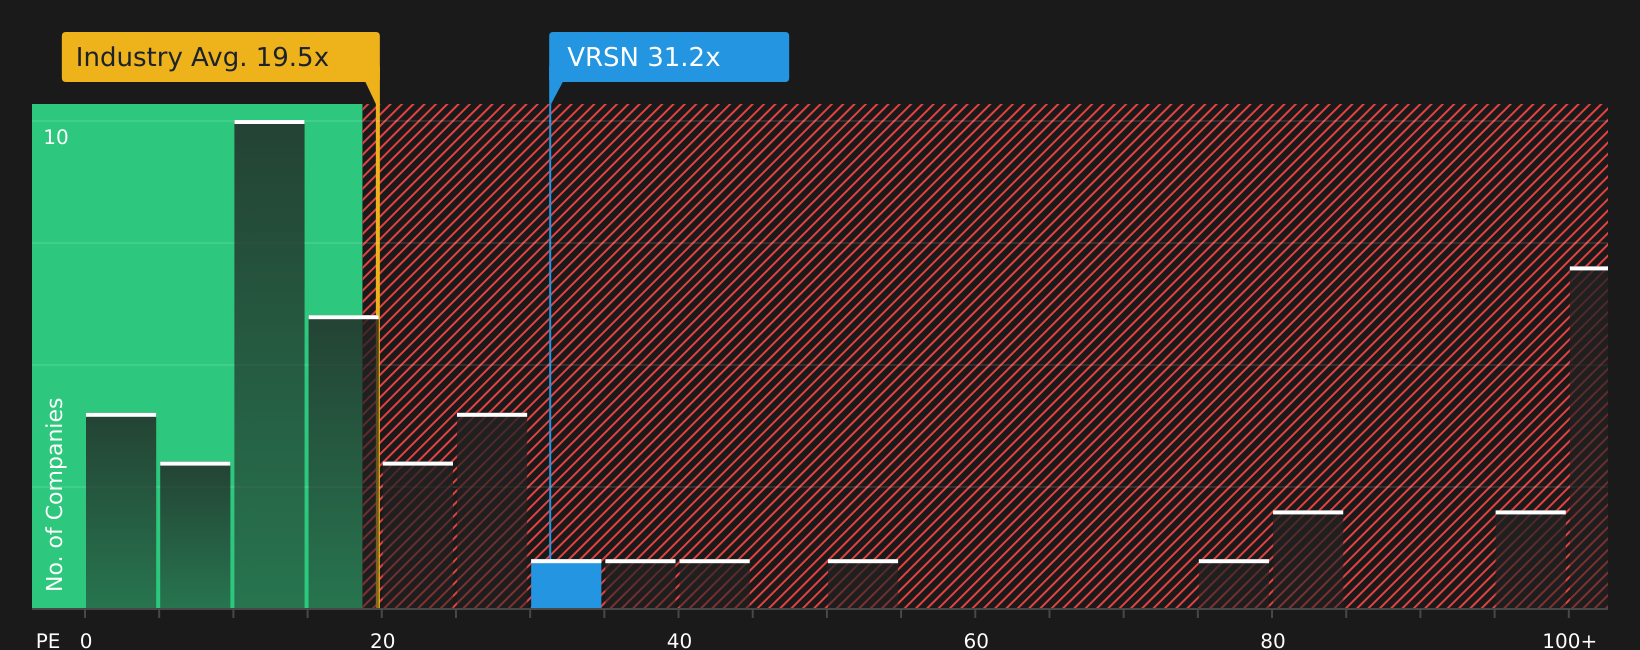
The user narrative flags VeriSign as sharply overvalued at $283.89 versus a fair value of $165, yet the P/E picture is more conflicted. At 30.8x earnings, the stock trades well above the US IT industry average of 17.4x, but below its peer group at 54.3x and above a 24.5x fair ratio.
In practice, that mix of cheaper than peers, richer than the sector, and above the fair ratio points to real valuation risk if sentiment cools or earnings fall short. The question is whether you see this as a premium that can hold or a gap that may eventually close.
See what the numbers say about this price — find out in our valuation breakdown.
Next Steps
With sentiment clearly split between valuation risk and business resilience, this is a moment to move fast, review the facts, and test your own thesis using the 2 key rewards and 3 important warning signs.
Looking for more investment ideas?
If VeriSign does not fully match your checklist, do not stop here. Broaden your watchlist now so you are not late to the next opportunity.
- Spot potential value plays quickly by scanning 46 high quality undervalued stocks that pair quality fundamentals with prices that may sit below their underlying metrics.
- Prioritise resilience by reviewing 63 resilient stocks with low risk scores that score well on financial health and business risk factors.
- Hunt for future leaders early by working through a screener containing 21 high quality undiscovered gems that focuses on quality metrics rather than headlines.
This article by Simply Wall St is general in nature. We provide commentary based on historical data and analyst forecasts only using an unbiased methodology and our articles are not intended to be financial advice. It does not constitute a recommendation to buy or sell any stock, and does not take account of your objectives, or your financial situation. We aim to bring you long-term focused analysis driven by fundamental data. Note that our analysis may not factor in the latest price-sensitive company announcements or qualitative material. Simply Wall St has no position in any stocks mentioned.
Have feedback on this article? Concerned about the content? Get in touch with us directly. Alternatively, email editorial-team@simplywallst.com