
- In the past quarter, MYR Group reported a very strong set of results, with revenue up 20% year on year and earnings outperforming analyst expectations across key profit measures.
- This earnings beat not only highlights the resilience of MYR Group’s business model, but also suggests its existing contracts and project mix may be contributing more effectively to profitability than analysts had anticipated.
- We’ll now examine how this stronger-than-expected quarterly performance, particularly the revenue outperformance, may influence MYR Group’s existing investment narrative.
Invest in the nuclear renaissance through our list of 88 elite nuclear energy infrastructure plays powering the global AI revolution.
MYR Group Investment Narrative Recap
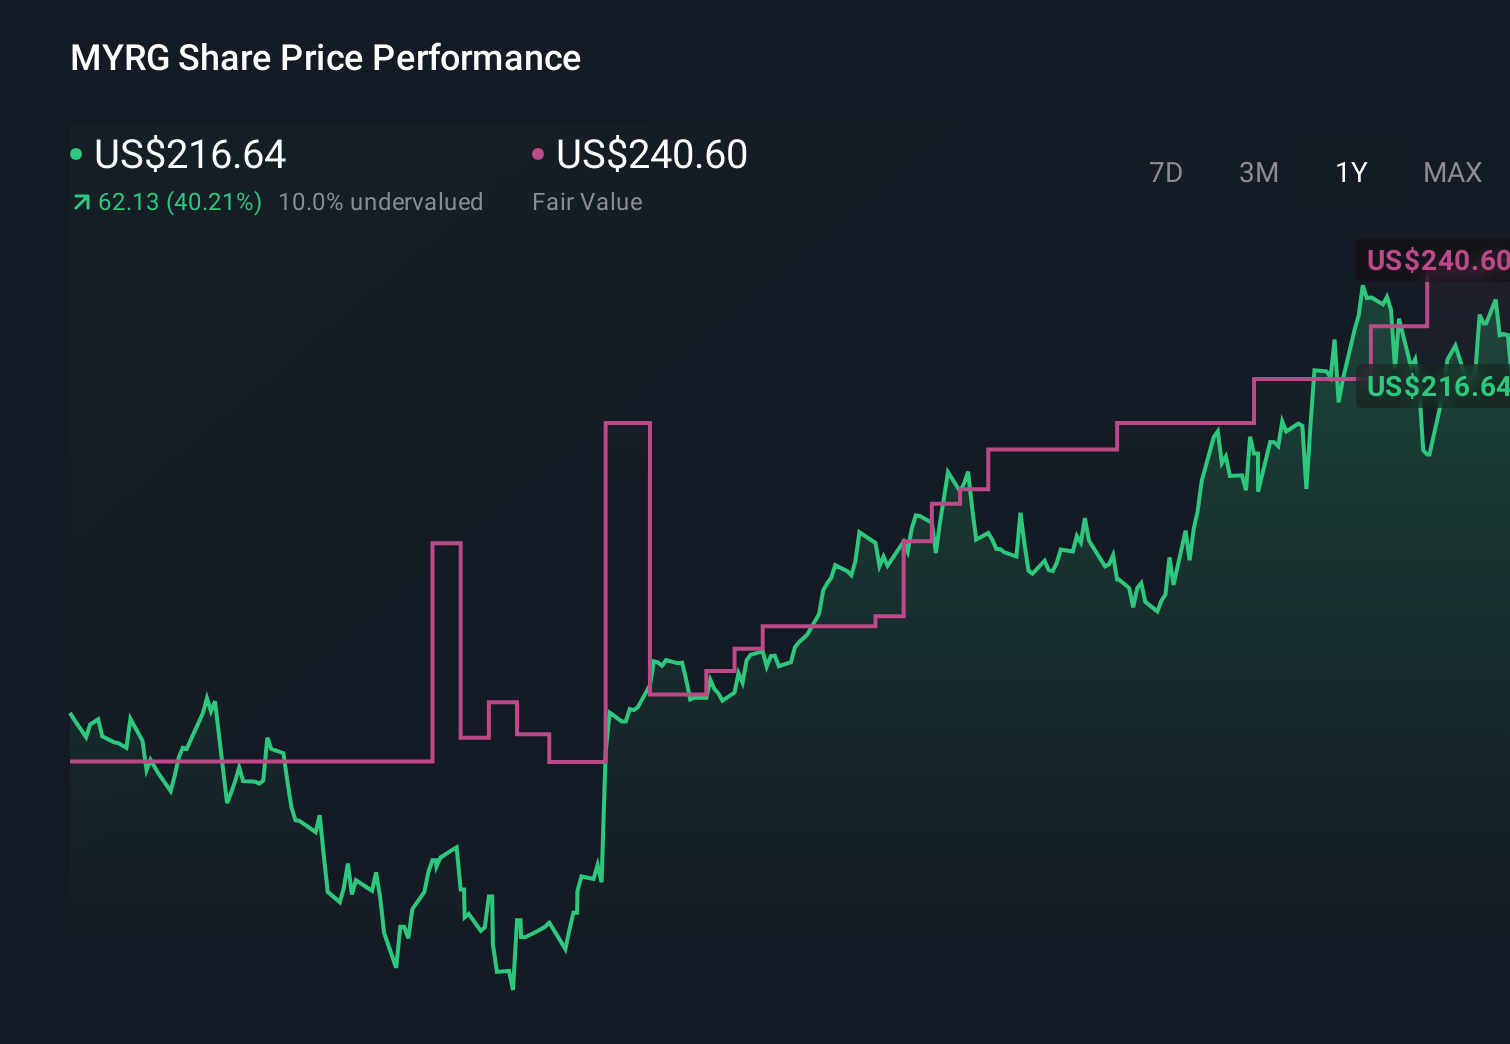
To invest in MYR Group, you generally need to believe in sustained demand for grid, electrification and complex commercial projects, supported by multi year utility agreements and critical infrastructure work. The latest quarter’s 20% revenue increase and earnings beat appear to reinforce this thesis in the near term, although the sharp recent share price move could heighten sensitivity to any setback in labor costs, project execution or backlog visibility.
Among recent announcements, the five year Design Build Electric Distribution Master Service Agreement with Xcel Energy, with anticipated work above US$500 million, stands out. It ties directly into the current earnings strength by supporting recurring T&D revenue and providing an anchor for backlog and resource planning, which may help offset some of the volatility risk in C&I projects if bidding or contract timing turns more uneven.
Yet investors should be aware that if utility spending slows or key MSAs are rebid on tighter terms, the recurring revenue profile could...
Read the full narrative on MYR Group (it's free!)
MYR Group's narrative projects $5.2 billion revenue and $253.1 million earnings by 2029. This requires 10.8% yearly revenue growth and about a $111.2 million earnings increase from $141.9 million today.
Uncover how MYR Group's forecasts yield a $455.00 fair value, in line with its current price.
Exploring Other Perspectives
The most bullish analysts already expected MYR Group to reach about US$5.1 billion in revenue and US$209.0 million in earnings by 2029, which is far more optimistic than consensus, so this latest quarter and the reliance on MSAs could shift those expectations in very different directions.
Explore 3 other fair value estimates on MYR Group - why the stock might be worth as much as $455.00!
Reach Your Own Conclusion
Don't just follow the ticker - dig into the data and build a conviction that's truly your own.
- A great starting point for your MYR Group research is our analysis highlighting 2 key rewards and 1 important warning sign that could impact your investment decision.
- Our free MYR Group research report provides a comprehensive fundamental analysis summarized in a single visual - the Snowflake - making it easy to evaluate MYR Group's overall financial health at a glance.
Want Some Alternatives?
Early movers are already taking notice. See the stocks they're targeting before they've flown the coop:
- Explore 30 top quantum computing companies leading the revolution in next-gen technology and shaping the future with breakthroughs in quantum algorithms, superconducting qubits, and cutting-edge research.
- Find 47 companies with promising cash flow potential yet trading below their fair value.
- AI is about to change healthcare. These 40 stocks are working on everything from early diagnostics to drug discovery. The best part - they are all under $10b in market cap - there's still time to get in early.
This article by Simply Wall St is general in nature. We provide commentary based on historical data and analyst forecasts only using an unbiased methodology and our articles are not intended to be financial advice. It does not constitute a recommendation to buy or sell any stock, and does not take account of your objectives, or your financial situation. We aim to bring you long-term focused analysis driven by fundamental data. Note that our analysis may not factor in the latest price-sensitive company announcements or qualitative material. Simply Wall St has no position in any stocks mentioned.
Have feedback on this article? Concerned about the content? Get in touch with us directly. Alternatively, email editorial-team@simplywallst.com