
- Manchester United plc recently reported past third-quarter results, with sales rising to £189.5 million from £160.56 million a year earlier but quarterly net loss increasing to £11.78 million, alongside updated player availability news including injuries and suspensions.
- Over the first nine months, the club’s sales edged up to £520.15 million while its cumulative net loss narrowed to £14.23 million, suggesting revenue growth has not yet translated into consistent quarterly profitability.
- We’ll now examine how the combination of higher quarterly sales and a wider quarterly net loss shapes Manchester United’s investment narrative.
Rare earth metals are an input to most high-tech devices, military and defence systems and electric vehicles. The global race is on to secure supply of these critical minerals. Beat the pack to uncover the 31 best rare earth metal stocks of the very few that mine this essential strategic resource.
What Is Manchester United's Investment Narrative?
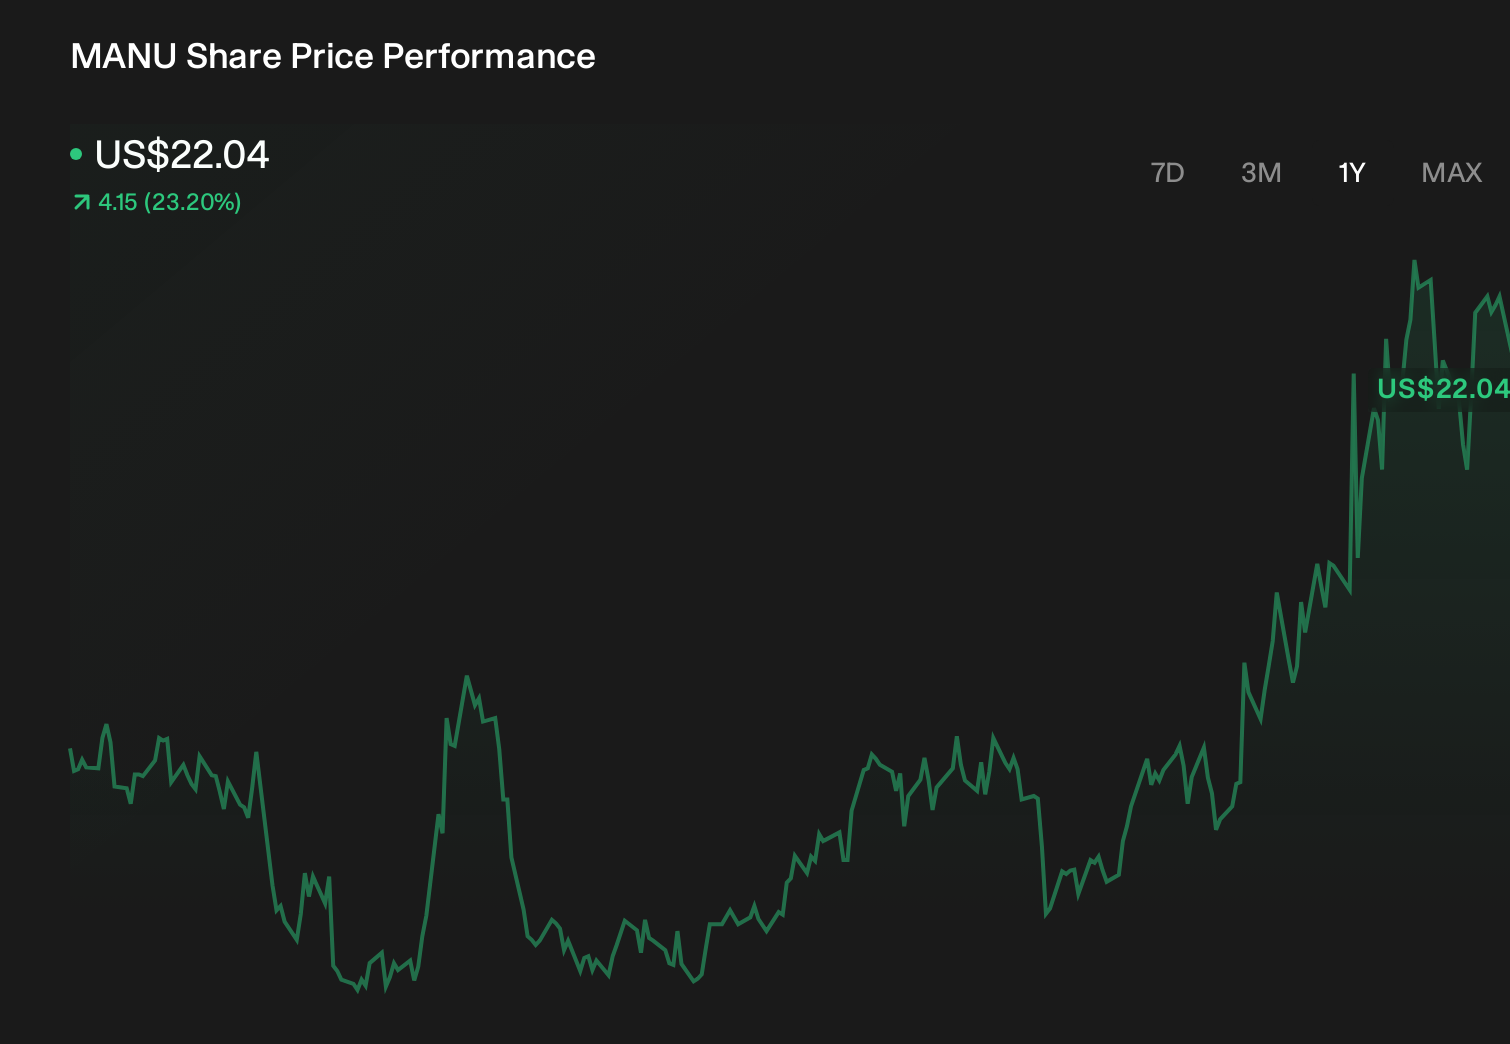
To own Manchester United stock, you have to believe the club can convert its global brand, media rights and sponsorship pull into sustainable profitability, despite a lumpy earnings profile. The latest quarter underscores that tension: sales climbed to £189.5 million, yet the net loss widened to £11.78 million, showing that higher matchday and commercial income are still being absorbed by wages, transfer amortisation and restructuring. Short term, this update slightly dulls the catalyst of an improving earnings story, but does not radically change it, given that nine‑month losses have narrowed to £14.23 million. On‑pitch news around injuries, suspensions and returns, while important for results and mood, is unlikely to be financially material on its own, unless it feeds into a deeper run of poor performances that affects broader revenues.
However, the club’s limited cash runway remains a key factor investors should not ignore. Manchester United's shares have been on the rise but are still potentially undervalued by 40%. Find out what it's worth.Exploring Other Perspectives
Explore 2 other fair value estimates on Manchester United - why the stock might be worth just $25.93!
Decide For Yourself
Don't just follow the ticker - dig into the data and build a conviction that's truly your own.
- A great starting point for your Manchester United research is our analysis highlighting 3 key rewards and 1 important warning sign that could impact your investment decision.
- Our free Manchester United research report provides a comprehensive fundamental analysis summarized in a single visual - the Snowflake - making it easy to evaluate Manchester United's overall financial health at a glance.
Seeking Other Investments?
The market won't wait. These fast-moving stocks are hot now. Grab the list before they run:
- Capitalize on the AI infrastructure supercycle with our selection of the 47 best 'picks and shovels' of the AI gold rush converting record-breaking demand into massive cash flow.
- Invest in the nuclear renaissance through our list of 88 elite nuclear energy infrastructure plays powering the global AI revolution.
- The future of work is here. Discover the 33 top robotics and automation stocks leading the charge in AI-driven automation and industrial transformation.
This article by Simply Wall St is general in nature. We provide commentary based on historical data and analyst forecasts only using an unbiased methodology and our articles are not intended to be financial advice. It does not constitute a recommendation to buy or sell any stock, and does not take account of your objectives, or your financial situation. We aim to bring you long-term focused analysis driven by fundamental data. Note that our analysis may not factor in the latest price-sensitive company announcements or qualitative material. Simply Wall St has no position in any stocks mentioned.
Have feedback on this article? Concerned about the content? Get in touch with us directly. Alternatively, email editorial-team@simplywallst.com