
First quarter earnings reset expectations for Nelnet stock
Nelnet (NNI) just posted first quarter results that showed net income of US$71.13 million and basic earnings per share of US$1.97, both lower than the same period last year. These results give investors fresh numbers to reassess the stock.
See our latest analysis for Nelnet.
Despite the softer quarterly profit, the share price closed at US$128.36 and has a 7 day share price return of 4.77%, although the 30 day share price return is down 7.93%. Over a longer horizon, shareholders have seen a 1 year total shareholder return of 8.71% and a 5 year total shareholder return of 79.50%. This suggests the recent pullback follows a much stronger multi year outcome.
If this mix of short term swings and long term compounding has you thinking about what else is out there, it could be a good time to uncover 18 top founder-led companies
With earnings per share at US$1.97, a share price around US$128, and a modest discount to analyst targets, the key question is whether Nelnet offers hidden value or if the market is already pricing in future growth.
Price-to-Earnings of 11.1x: Is it justified?
On a P/E of 11.1x, Nelnet trades at a level that sits below the wider US market but above both the Consumer Finance industry and its closest peers.
The P/E ratio compares the current share price with earnings per share, so it gives you a shorthand view of how much investors are paying for each dollar of profit. For a diversified financial company like Nelnet, it is a quick way to see how the market weighs its earnings profile, business mix across loan servicing, education technology and banking, and the quality of those profits.
At 11.1x earnings, the stock is cheaper than the broader US market average of 18.4x. This points to a lower earnings multiple than the typical company. However, the same P/E is higher than both the US Consumer Finance industry average of 9.3x and the peer group average of 9.7x. This means investors are currently paying a premium versus closer comparables.
That premium sits alongside mixed signals in the fundamentals. These include high quality earnings and strong recent profit growth, but also a history of earnings decline over five years, low return on equity at 10.3% and debt that is not well covered by operating cash flow. With the stock also trading above the SWS DCF estimate of future cash flow value of $22.14, the higher P/E relative to industry and peers suggests the market is not pricing Nelnet as a clear bargain on earnings alone.
See what the numbers say about this price — find out in our valuation breakdown.
Result: Price-to-Earnings of 11.1x (OVERVALUED)
However, slower revenue growth at 4.98% and debt that is not well covered by operating cash flow could pressure earnings and challenge the current valuation narrative.
Find out about the key risks to this Nelnet narrative.
Another way to look at Nelnet's value
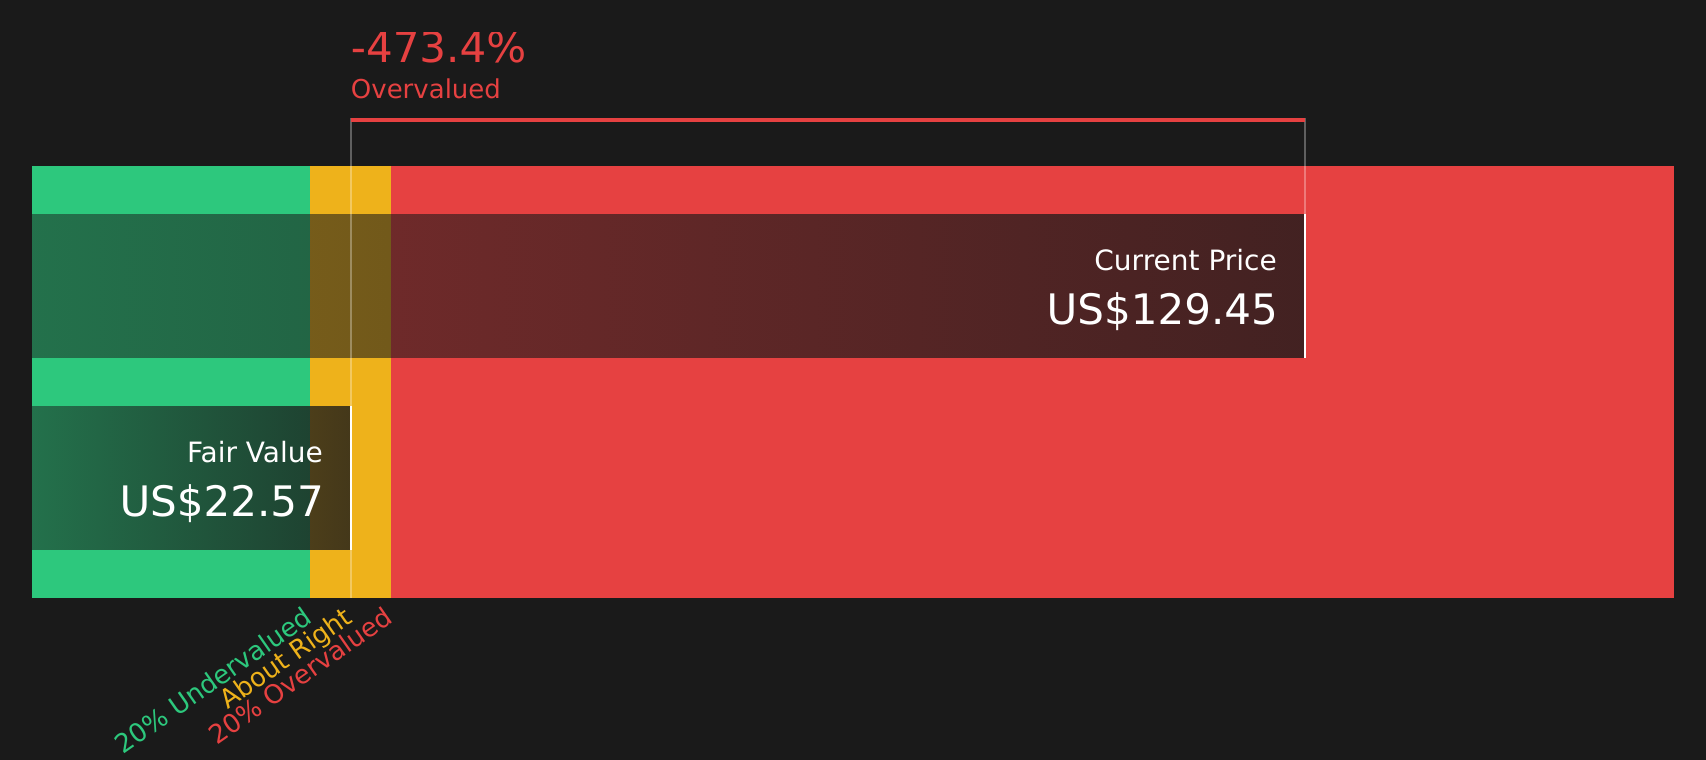
Our DCF model paints a very different picture, with an estimated future cash flow value of about $22.14 per share compared with the current $128.36 price. That gap points to valuation risk rather than a clear opportunity, so the real question is which story you trust more.
Look into how the SWS DCF model arrives at its fair value.
Simply Wall St performs a discounted cash flow (DCF) on every stock in the world every day (check out Nelnet for example). We show the entire calculation in full. You can track the result in your watchlist or portfolio and be alerted when this changes, or use our stock screener to discover 51 high quality undervalued stocks. If you save a screener we even alert you when new companies match - so you never miss a potential opportunity.
Next Steps
With mixed signals across valuation and fundamentals, it makes sense to pressure test the story for yourself and move quickly while information is fresh. To weigh the potential upside against the issues investors are worried about, start by reviewing the 2 key rewards and 2 important warning signs.
Looking for more investment ideas?
If Nelnet has sharpened your focus, do not stop here. The market is full of other stocks with very different risk, income, and quality profiles waiting to be reviewed.
- Target reliable income streams and stress test your dividend expectations with the 12 dividend fortresses.
- Zero in on quality at a reasonable price by checking out the 51 high quality undervalued stocks.
- Prioritise capital protection by scanning the 65 resilient stocks with low risk scores before the next bout of volatility hits.
This article by Simply Wall St is general in nature. We provide commentary based on historical data and analyst forecasts only using an unbiased methodology and our articles are not intended to be financial advice. It does not constitute a recommendation to buy or sell any stock, and does not take account of your objectives, or your financial situation. We aim to bring you long-term focused analysis driven by fundamental data. Note that our analysis may not factor in the latest price-sensitive company announcements or qualitative material. Simply Wall St has no position in any stocks mentioned.
Have feedback on this article? Concerned about the content? Get in touch with us directly. Alternatively, email editorial-team@simplywallst.com