
- Some investors may be wondering whether Alaska Air Group at around US$36.78 is starting to look interesting again, or if the market is still pricing in too much risk.
- The stock has seen a 4.4% decline over the last week, a 28.7% fall over the past month, and a 25.0% decline over the last year, which can change how the market views both its potential and its risk profile.
- These moves sit against a longer backdrop where the shares are down 12.4% over three years and 50.1% over five years. That may influence how investors think about recovery potential. For anyone watching long term trends, that context is just as important as the latest price tick.
- On Simply Wall St's valuation checks, Alaska Air Group currently scores 1 out of 6 for being potentially undervalued. Next up is a look at how different valuation approaches frame that score and why there may be an even more useful way to think about value by the end of this article.
Alaska Air Group scores just 1/6 on our valuation checks. See what other red flags we found in the full valuation breakdown.
Approach 1: Alaska Air Group Discounted Cash Flow (DCF) Analysis
A Discounted Cash Flow, or DCF, model estimates what a company might be worth today by projecting its future cash flows and discounting them back to a present value.
For Alaska Air Group, the latest twelve month Free Cash Flow is a loss of about $457.7 million. Analyst and extrapolated projections used in the two stage Free Cash Flow to Equity model show Free Cash Flow turning positive, with around $193.9 million in 2026 and $190.1 million in 2028, then tapering through to smaller figures by 2035. All of these are expressed in US$ and remain well below the billion level.
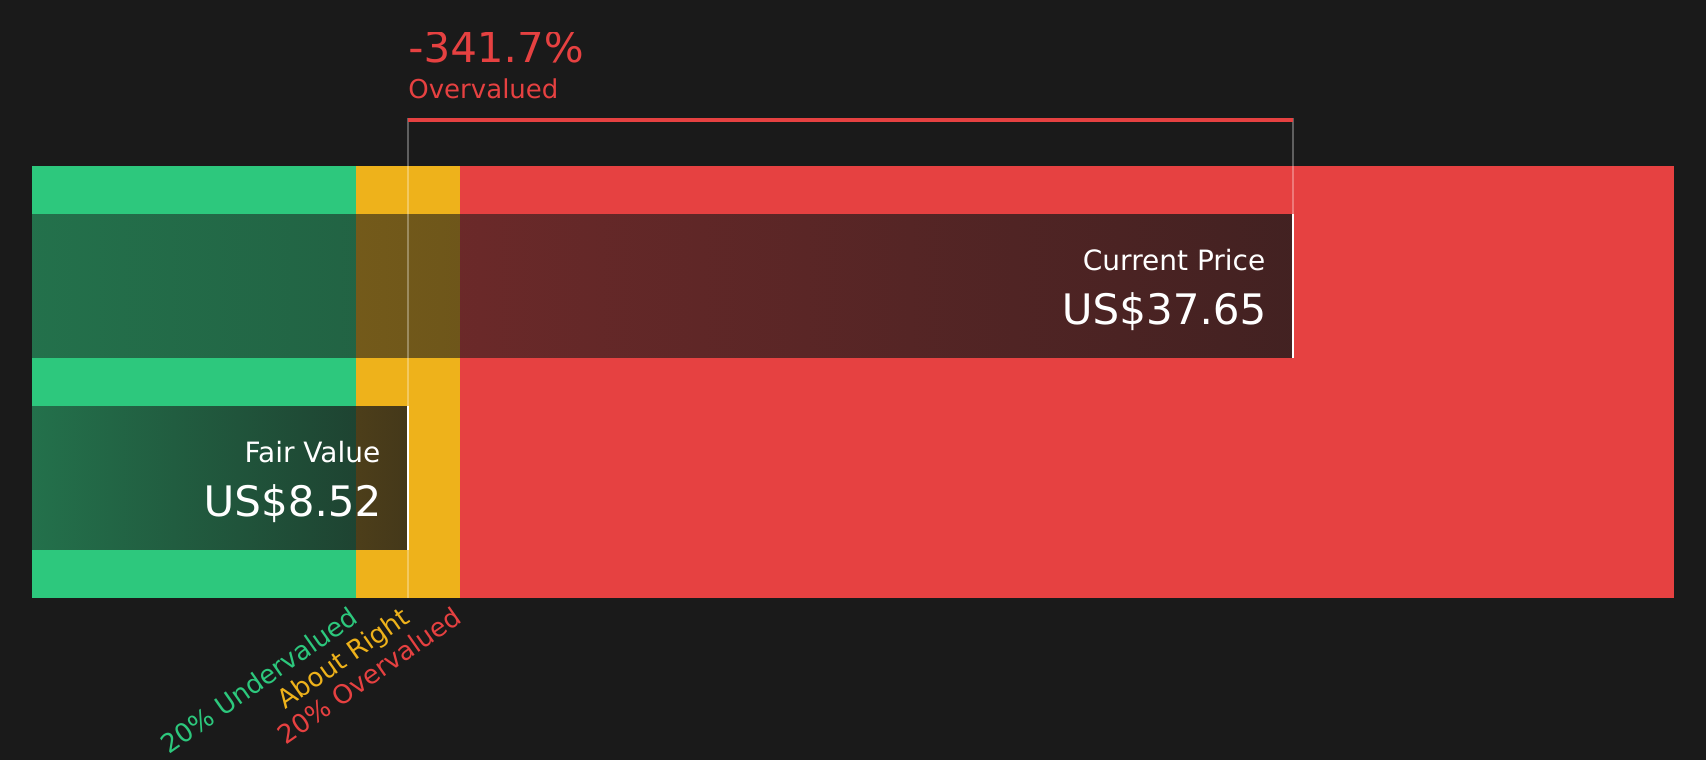
When all projected cash flows are discounted back using this model, Simply Wall St estimates an intrinsic value of about $8.46 per share for NYSE:ALK. Compared with the recent share price of about $36.78, this particular DCF suggests the stock is very heavily overvalued, with an implied premium of roughly 335%.
Result: OVERVALUED
Our Discounted Cash Flow (DCF) analysis suggests Alaska Air Group may be overvalued by 335.0%. Discover 58 high quality undervalued stocks or create your own screener to find better value opportunities.
Approach 2: Alaska Air Group Price vs Earnings
For profitable companies, the P/E ratio is often a useful way to think about value because it links what you pay for each share directly to the earnings that support it. A higher or lower P/E can make sense depending on what the market expects for future growth and how much risk investors see in those earnings.
Alaska Air Group currently trades on a P/E of about 41.68x. That sits well above the Airlines industry average P/E of 8.24x and also above the peer average of 21.32x. On the face of it, the market is putting a richer price on each dollar of Alaska Air Group’s earnings than it is on the typical airline stock.
Simply Wall St’s Fair Ratio is designed to refine that comparison. Instead of only lining the stock up against peers or the sector, it estimates what a “normal” P/E might be for this specific company, given factors such as its earnings growth profile, profitability, industry, market cap and risk. For Alaska Air Group, the Fair Ratio is 42.04x, which sits very close to the current 41.68x P/E. That suggests the shares are priced at about the level implied by those fundamentals.
Result: ABOUT RIGHT

P/E ratios tell one story, but what if the real opportunity lies elsewhere? Start investing in legacies, not executives. Discover our 20 top founder-led companies.
Upgrade Your Decision Making: Choose your Alaska Air Group Narrative
Earlier we mentioned that there is an even better way to understand valuation. Narratives on Simply Wall St let you turn your view of Alaska Air Group into a clear story that links what you think about its routes, integration of Hawaiian Airlines, costs and demand to specific forecasts for revenue, earnings and margins, and then to a Fair Value that you can compare with today’s share price.
Each Narrative is created by investors inside the Community page and connects a company story to a full financial model. When new news or earnings arrive, the Fair Value updates automatically and you can quickly see whether your story still justifies buying, holding, or selling, or if the gap between price and value has closed.
For Alaska Air Group, one investor might build a more optimistic Narrative that lines up with a Fair Value of about US$86.98 per share. Another might use more conservative assumptions that lead to a Fair Value closer to US$49 or US$60. Looking at that range side by side can help you decide which story you think is more realistic before you act.
Do you think there's more to the story for Alaska Air Group? Head over to our Community to see what others are saying!

This article by Simply Wall St is general in nature. We provide commentary based on historical data and analyst forecasts only using an unbiased methodology and our articles are not intended to be financial advice. It does not constitute a recommendation to buy or sell any stock, and does not take account of your objectives, or your financial situation. We aim to bring you long-term focused analysis driven by fundamental data. Note that our analysis may not factor in the latest price-sensitive company announcements or qualitative material. Simply Wall St has no position in any stocks mentioned.
Have feedback on this article? Concerned about the content? Get in touch with us directly. Alternatively, email editorial-team@simplywallst.com