
- If you are wondering whether V.F at around US$16.99 is a bargain or a trap, the answer comes down to what you think its current price really reflects.
- The stock has had a mixed run, with a 12.5% decline over the last 30 days but an 8.0% return over the past year, which can signal changing views on both its potential and its risks.
- Recent headlines around V.F have focused on its long term share price performance, including a 17.0% annualized decline over three years and a 76.0% decline over five years from previous levels. This frames the current price in a very different light and is often front of mind for investors who see the recent 1 year gain and are asking whether this is a turn in sentiment or just a pause in a longer slump.
- On Simply Wall St's valuation checks, V.F scores 2 out of 6, as shown in the valuation summary. Next up is a look at how different valuation methods judge the stock today and why there may be an even more helpful way to think about value by the end of this article.
V.F scores just 2/6 on our valuation checks. See what other red flags we found in the full valuation breakdown.
Approach 1: V.F Discounted Cash Flow (DCF) Analysis
A Discounted Cash Flow, or DCF, model estimates what a company could be worth by projecting its future cash flows and discounting them back to today using a required rate of return.
For V.F, the model used is a 2 Stage Free Cash Flow to Equity approach, based on cash flows reported and projected in $. The latest twelve month Free Cash Flow is about $303.7 million. Analyst inputs extend out to 2028, where Free Cash Flow is projected at $674.7 million, and Simply Wall St then extrapolates estimates further, with the 2035 projection at $1.0b. All of these future cash flows are discounted back to reach an estimate of what the equity might be worth today.
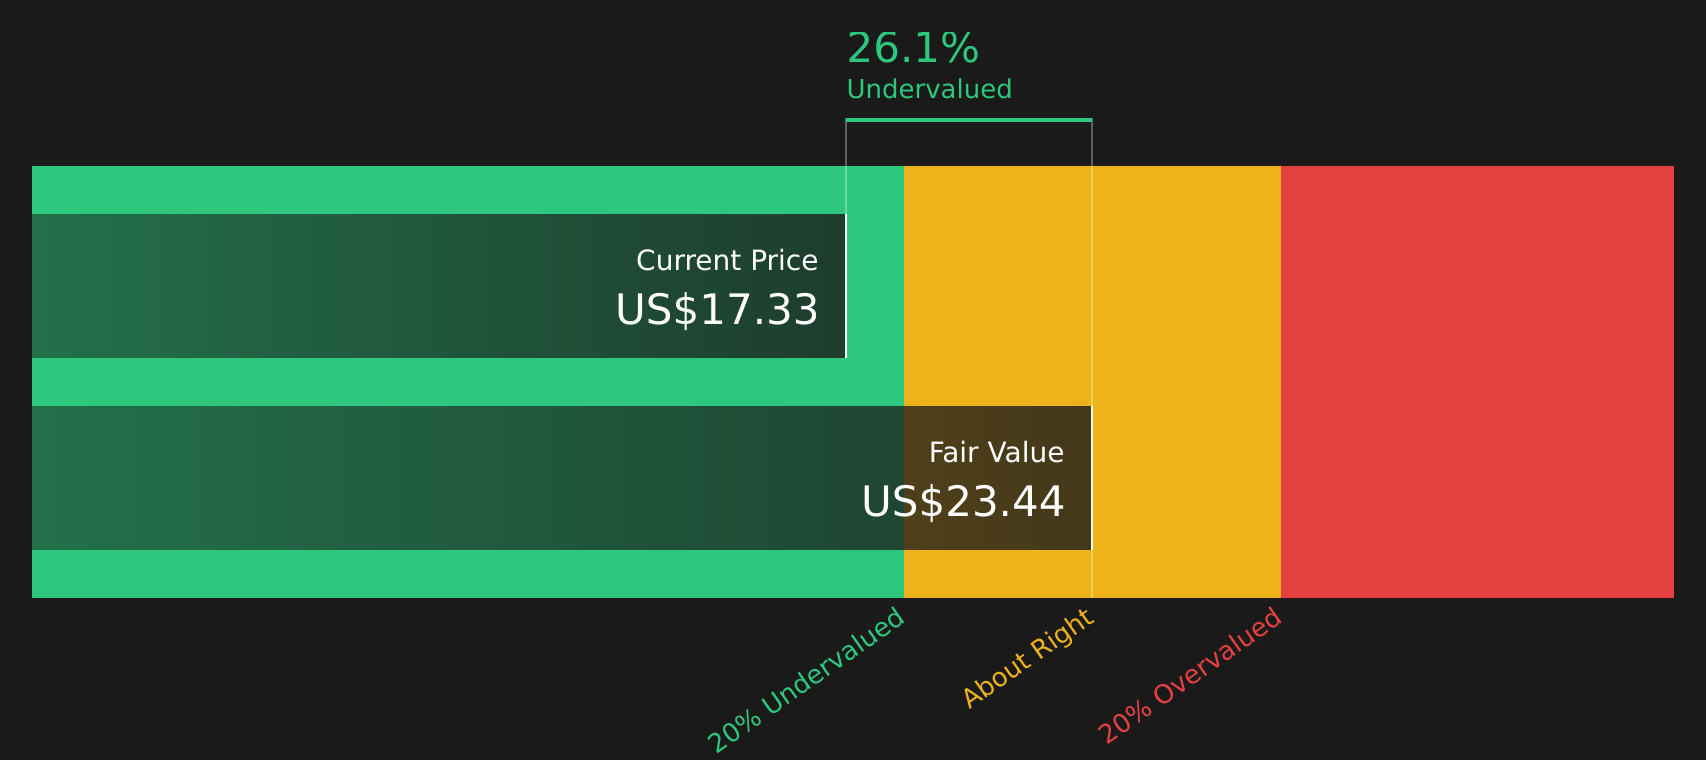
On this basis, the DCF model arrives at an estimated intrinsic value of about $23.21 per share. Compared to the current share price of around $16.99, this implies the shares trade at a 26.8% discount, which suggests V.F may be undervalued on this metric.
Result: UNDERVALUED
Our Discounted Cash Flow (DCF) analysis suggests V.F is undervalued by 26.8%. Track this in your watchlist or portfolio, or discover 58 more high quality undervalued stocks.
Approach 2: V.F Price vs Earnings
For profitable companies, the P/E ratio is a useful shorthand for what investors are paying today for each dollar of current earnings. It links the share price directly to earnings, which are typically a key driver of long term returns.
What counts as a "normal" P/E depends on how the market views a company’s growth potential and risk. Higher expected growth or lower perceived risk can support a higher P/E, while lower growth expectations or higher risk usually point to a lower, more cautious multiple.
V.F currently trades on a P/E of 29.69x. That sits above the Luxury industry average of 18.83x and also above the peer group average of 14.20x. Simply Wall St’s Fair Ratio for V.F is 25.98x, which is its proprietary estimate of what a reasonable P/E could be after factoring in the company’s earnings profile, industry, profit margins, market value and risk characteristics.
This Fair Ratio aims to be more tailored than a simple industry or peer comparison because it adjusts for company specific features rather than treating all Luxury names as identical. Compared to this Fair Ratio, V.F’s current 29.69x P/E is higher, which points to the shares trading at a richer level on this metric.
Result: OVERVALUED

P/E ratios tell one story, but what if the real opportunity lies elsewhere? Start investing in legacies, not executives. Discover our 20 top founder-led companies.
Upgrade Your Decision Making: Choose your V.F Narrative
Earlier it was mentioned that there is an even better way to understand valuation. Narratives on Simply Wall St’s Community page let you attach a clear story about V.F to the numbers by linking your view on its future revenue, earnings and margins to a fair value estimate. This updates automatically as news or earnings arrive and provides a simple framework for comparing that Fair Value to today’s price, whether you lean toward a higher outcome such as US$40.00 or a more cautious view closer to US$10.00.
For V.F however, we will make it really easy for you with previews of two leading V.F narratives:
First is a higher value case that assumes the recovery work starts to pay off.
Fair value in this bullish narrative: US$31.42 per share.
At the last close of US$16.99, that implies the shares trade at around a 45.9% discount to this fair value.
Revenue growth assumption: 3.45% a year.
- Assumes cost transformation, a more digital-first model, and margin progress support a higher quality earnings base over time.
- Bullish analysts model revenue of US$10.8b and earnings of US$721.2m by 2028, with profit margins rising and a P/E of 20.8x on those earnings.
- This view leans on stronger performance at The North Face and Timberland, improving Vans, and a higher fair value of US$27.85 based on the upper end of analyst targets.
The second view leans the other way and focuses on the risk that expectations are still too high.
Fair value in this bearish narrative: US$14.00 per share.
At the last close of US$16.99, that implies the shares trade at around a 17.6% premium to this fair value.
Revenue growth assumption: 0.53% decline a year.
- Assumes structural pressure on legacy brands like Vans and ongoing demand weakness keep a lid on revenue and margins.
- Bearish analysts model revenue of US$9.1b and earnings of US$439.2m by 2028, with a lower 12.3x P/E used to support a US$10.00 price target at the bottom of the range.
- This view highlights risks from brand fatigue, heavier discounting, rising costs, and the possibility that even with some improvement, the current price already embeds too much optimism.
These two narratives bracket the current US$16.99 share price with different assumptions on revenue, margins, and the P/E that investors might be willing to pay. This gives you a starting point to decide which story feels closer to your own view of V.F.
Do you think there's more to the story for V.F? Head over to our Community to see what others are saying!

This article by Simply Wall St is general in nature. We provide commentary based on historical data and analyst forecasts only using an unbiased methodology and our articles are not intended to be financial advice. It does not constitute a recommendation to buy or sell any stock, and does not take account of your objectives, or your financial situation. We aim to bring you long-term focused analysis driven by fundamental data. Note that our analysis may not factor in the latest price-sensitive company announcements or qualitative material. Simply Wall St has no position in any stocks mentioned.
Have feedback on this article? Concerned about the content? Get in touch with us directly. Alternatively, email editorial-team@simplywallst.com