
- This article walks through key numbers to help you judge whether Moody's current share price lines up with its underlying worth and if the stock looks expensive, cheap or somewhere in between.
- Moody's last closed at US$436.25, with returns of 1.8% over 7 days, an 8.7% decline over 30 days, a 12.6% decline year to date and a 6.2% decline over the last year. The 3 year and 5 year returns stand at 47.1% and 47.0% respectively.
- Recent coverage has focused on how Moody's performance over 3 and 5 years compares with its more recent share price weakness. This has drawn attention to whether expectations have shifted. This mix of longer term gains and shorter term declines has put the question of fair value front and center for many investors.
- On Simply Wall St's valuation checks, Moody's scores 2 out of 6, which suggests some aspects look attractive while others may not. The rest of this article walks through common valuation methods before finishing with a different way to think about what the stock could be worth.
Moody's scores just 2/6 on our valuation checks. See what other red flags we found in the full valuation breakdown.
Approach 1: Moody's Excess Returns Analysis
The Excess Returns model looks at how much profit Moody's may generate above the return that equity investors typically require, then capitalizes those extra profits into an estimated value per share.
For Moody's, the inputs reflect a business that, based on analyst estimates, is expected to earn more than its implied cost of equity on each dollar of book value. Book value is $22.83 per share and the stable book value used in the model is $28.50 per share, based on weighted future book value estimates from 5 analysts. The model uses a stable EPS of $19.80 per share, sourced from weighted future return on equity estimates from 7 analysts.
The cost of equity is set at $2.26 per share, which implies an excess return of $17.54 per share. That excess return is anchored by an average return on equity of 69.47% in the model.
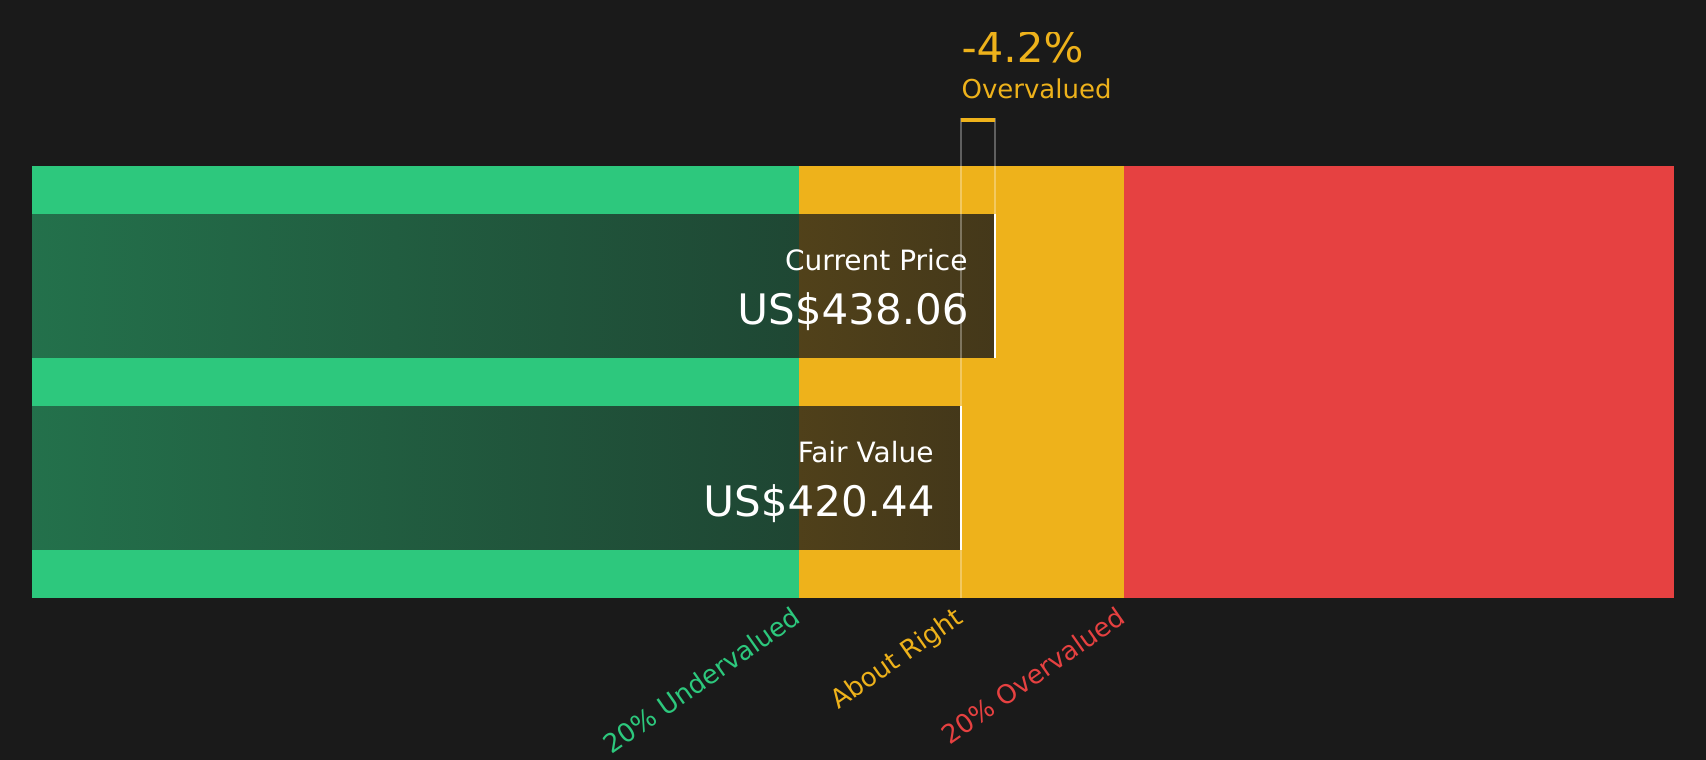
Putting these pieces together, the Excess Returns model arrives at an intrinsic value of about US$417.82 per share, which is around a 4.4% premium to the recent share price of US$436.25. On this measure, Moody's appears slightly overvalued but broadly in the right ballpark.
Result: ABOUT RIGHT
Moody's is fairly valued according to our Excess Returns, but this can change at a moment's notice. Track the value in your watchlist or portfolio and be alerted on when to act.
Approach 2: Moody's Price vs Earnings
For a profitable company like Moody's, the P/E ratio is a useful shorthand for how much investors are paying for each dollar of current earnings. It helps you compare the share price with what the business is actually earning today.
What counts as a "normal" or "fair" P/E depends on how investors view growth potential and risk. Higher expected growth or lower perceived risk can justify a higher P/E, while lower growth or higher risk can point to a lower one.
Moody's currently trades on a P/E of 31.58x. That sits below the broader Capital Markets industry average of 33.13x, but above the peer group average of 27.25x. Simply comparing to these benchmarks only tells part of the story.
Simply Wall St's Fair Ratio is designed to go further. It estimates what P/E might make sense for Moody's given factors like its earnings growth profile, industry, profit margins, market cap and specific risks. For Moody's, the Fair Ratio stands at 17.50x, which is more tailored than a simple peer or industry comparison.
Comparing the current P/E of 31.58x with the Fair Ratio of 17.50x suggests the shares trade at a premium to what this framework would point to.
Result: OVERVALUED

P/E ratios tell one story, but what if the real opportunity lies elsewhere? Start investing in legacies, not executives. Discover our 20 top founder-led companies.
Upgrade Your Decision Making: Choose your Moody's Narrative
Earlier the article mentioned that there is an even better way to understand valuation, so Narratives are introduced here as a simple way for you to attach a clear story about Moody's future to concrete numbers like fair value, expected revenue, earnings and margins, then see how that story stacks up against today's share price.
On Simply Wall St's Community page, Narratives let you set assumptions, turn them into a financial forecast and a fair value, and then compare that fair value with the current price. This can help you judge whether Moody's looks closer to a buy, a hold or a sell for your own plan, without needing to build a full model from scratch.
Narratives also update automatically as new news, earnings or analyst inputs are added, so your view of Moody's does not stay frozen and you can quickly see whether fresh information pushes your fair value further above or below the market price.
For example, one Moody's Narrative on Simply Wall St currently points to a fair value of about US$551.41 per share using a DCF based blend of methods. Another Narrative built from analyst assumptions arrives at about US$575.53 per share. This shows how different investors can look at the same company, use different but explicit assumptions, and still have a structured way to compare those views with where the stock actually trades.
Do you think there's more to the story for Moody's? Head over to our Community to see what others are saying!

This article by Simply Wall St is general in nature. We provide commentary based on historical data and analyst forecasts only using an unbiased methodology and our articles are not intended to be financial advice. It does not constitute a recommendation to buy or sell any stock, and does not take account of your objectives, or your financial situation. We aim to bring you long-term focused analysis driven by fundamental data. Note that our analysis may not factor in the latest price-sensitive company announcements or qualitative material. Simply Wall St has no position in any stocks mentioned.
Have feedback on this article? Concerned about the content? Get in touch with us directly. Alternatively, email editorial-team@simplywallst.com