
- If you are wondering whether StoneX Group at around US$80.65 is offering value or asking too much, you are not alone. This article is built to help you frame that question clearly.
- The stock has returned 8.8% over the last 7 days, while the 30 day return is a 5.1% decline. On a longer view, the year to date return is 24.2% and the 1 year return is 58.2%, with very large gains over 3 and 5 years.
- Recent trading interest has been shaped by ongoing attention on capital markets and financial services companies, as investors reassess where they want exposure in that part of the market. StoneX Group often features in discussions about diversified financials, which can influence how investors respond to price moves even in the absence of company specific headlines.
- Despite this share price history, the Simply Wall St valuation model gives StoneX Group a value score of 1 out of 6. Next you will see how different valuation methods judge the stock today, before looking at a broader way to think about value that goes beyond any single model.
StoneX Group scores just 1/6 on our valuation checks. See what other red flags we found in the full valuation breakdown.
Approach 1: StoneX Group Excess Returns Analysis
The Excess Returns model asks a simple question: after covering the required return that equity investors expect, how much profit is left over on each share, and for how long might that continue?
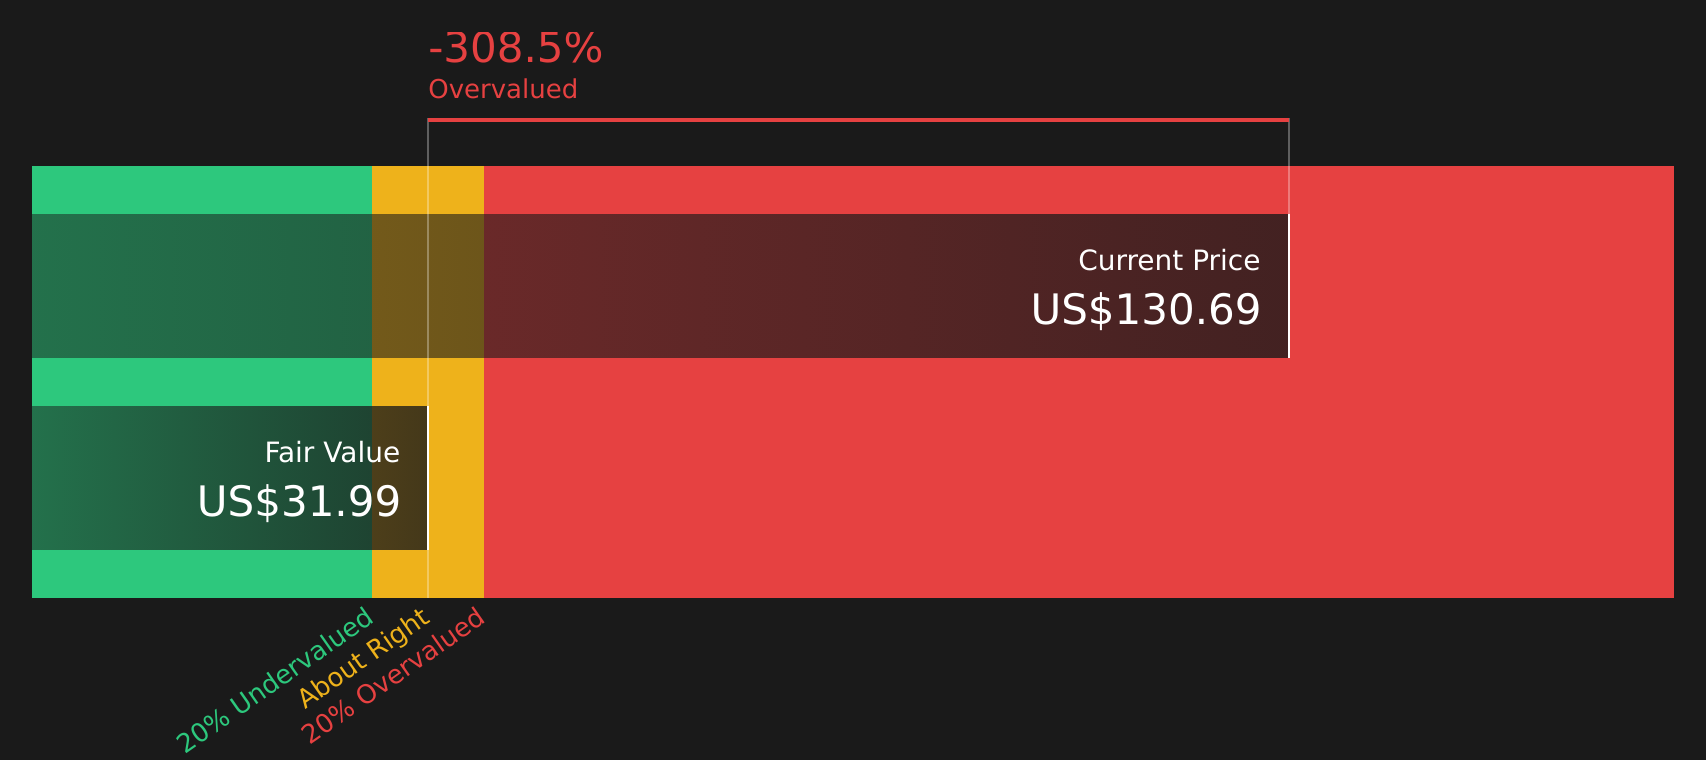
For StoneX Group, the model uses a Book Value of $32.12 per share and a Stable EPS of $3.39 per share, based on the median return on equity from the past 5 years. The average Return on Equity is 15.08%, while the Cost of Equity is $2.78 per share. That leaves an Excess Return of $0.62 per share, which is the profit above the model’s required return. The Stable Book Value input is $22.51 per share, taken from the median book value over the past 5 years.
Combining these inputs, the Excess Returns framework produces an estimated intrinsic value of about $29.44 per share. Compared with the current share price around $80.65, this implies the stock is 173.9% overvalued according to this model.
Result: OVERVALUED
Our Excess Returns analysis suggests StoneX Group may be overvalued by 173.9%. Discover 58 high quality undervalued stocks or create your own screener to find better value opportunities.
Approach 2: StoneX Group Price vs Earnings
For a profitable business like StoneX Group, the P/E ratio is a straightforward way to see what you are paying for each dollar of earnings. A higher or lower P/E often reflects what the market is building in for future growth and how risky those earnings might be, so there is no single "right" number without that context.
StoneX Group currently trades on a P/E of 18.26x. That sits below the broader Capital Markets industry average of 33.02x, and modestly above the peer group average of 16.20x. To move beyond simple comparisons, Simply Wall St uses a "Fair Ratio" of 15.52x for StoneX Group, which is the P/E level suggested by factors such as its earnings growth profile, industry, profit margins, market cap and specific risks.
This Fair Ratio is more tailored than a straight peer or industry comparison because it adjusts for the company’s own characteristics rather than assuming all Capital Markets stocks deserve similar multiples. Set against the current 18.26x P/E, the 15.52x Fair Ratio suggests the shares are trading on a richer multiple than the model implies.
Result: OVERVALUED

P/E ratios tell one story, but what if the real opportunity lies elsewhere? Start investing in legacies, not executives. Discover our 20 top founder-led companies.
Upgrade Your Decision Making: Choose your StoneX Group Narrative
Earlier it was mentioned that there is an even better way to understand valuation. This is where Narratives come in, giving you a simple story that sits behind your fair value, revenue, earnings and margin assumptions for a company like StoneX Group.
A Narrative connects what you believe about the business, such as how it competes or manages risk, to a financial forecast and then to a fair value that you can compare directly with today’s share price.
On Simply Wall St, Narratives are available on the Community page, used by millions of investors. They update automatically when fresh information like news or earnings is released, so your story and its fair value stay aligned with the latest data.
With StoneX Group, one investor might build a Narrative that supports a much higher fair value than the current share price, while another might settle on a much lower fair value. Both can clearly see whether their view suggests the stock is above or below their own estimate.
Do you think there's more to the story for StoneX Group? Head over to our Community to see what others are saying!

This article by Simply Wall St is general in nature. We provide commentary based on historical data and analyst forecasts only using an unbiased methodology and our articles are not intended to be financial advice. It does not constitute a recommendation to buy or sell any stock, and does not take account of your objectives, or your financial situation. We aim to bring you long-term focused analysis driven by fundamental data. Note that our analysis may not factor in the latest price-sensitive company announcements or qualitative material. Simply Wall St has no position in any stocks mentioned.
Have feedback on this article? Concerned about the content? Get in touch with us directly. Alternatively, email editorial-team@simplywallst.com