
The United States market has experienced a 1.9% decline over the last week, yet it remains up by 15% over the past year, with earnings projected to grow annually by 15%. In this dynamic environment, identifying stocks like Seneca Foods that offer unique value propositions and growth potential can be key to uncovering hidden opportunities.
Top 10 Undiscovered Gems With Strong Fundamentals In The United States
| Name | Debt To Equity | Revenue Growth | Earnings Growth | Health Rating |
|---|---|---|---|---|
| First Bancorp | 68.18% | 1.28% | -2.88% | ★★★★★★ |
| Security Federal | 17.59% | 5.51% | 0.13% | ★★★★★★ |
| Cashmere Valley Bank | 31.17% | 5.25% | 1.74% | ★★★★★★ |
| Oakworth Capital | 26.12% | 15.98% | 13.01% | ★★★★★★ |
| ASA Gold and Precious Metals | NA | 12.65% | 41.20% | ★★★★★★ |
| Winchester Bancorp | 121.44% | 49.13% | 3283.33% | ★★★★★★ |
| Union Bankshares | 374.44% | 1.11% | -7.71% | ★★★★★☆ |
| Seneca Foods | 38.64% | 2.39% | -18.65% | ★★★★★☆ |
| NameSilo Technologies | 12.63% | 14.48% | 3.12% | ★★★★★☆ |
| Pure Cycle | 5.42% | 9.36% | -2.03% | ★★★★★☆ |
Let's dive into some prime choices out of from the screener.
Seneca Foods (SENE.A)
Simply Wall St Value Rating: ★★★★★☆
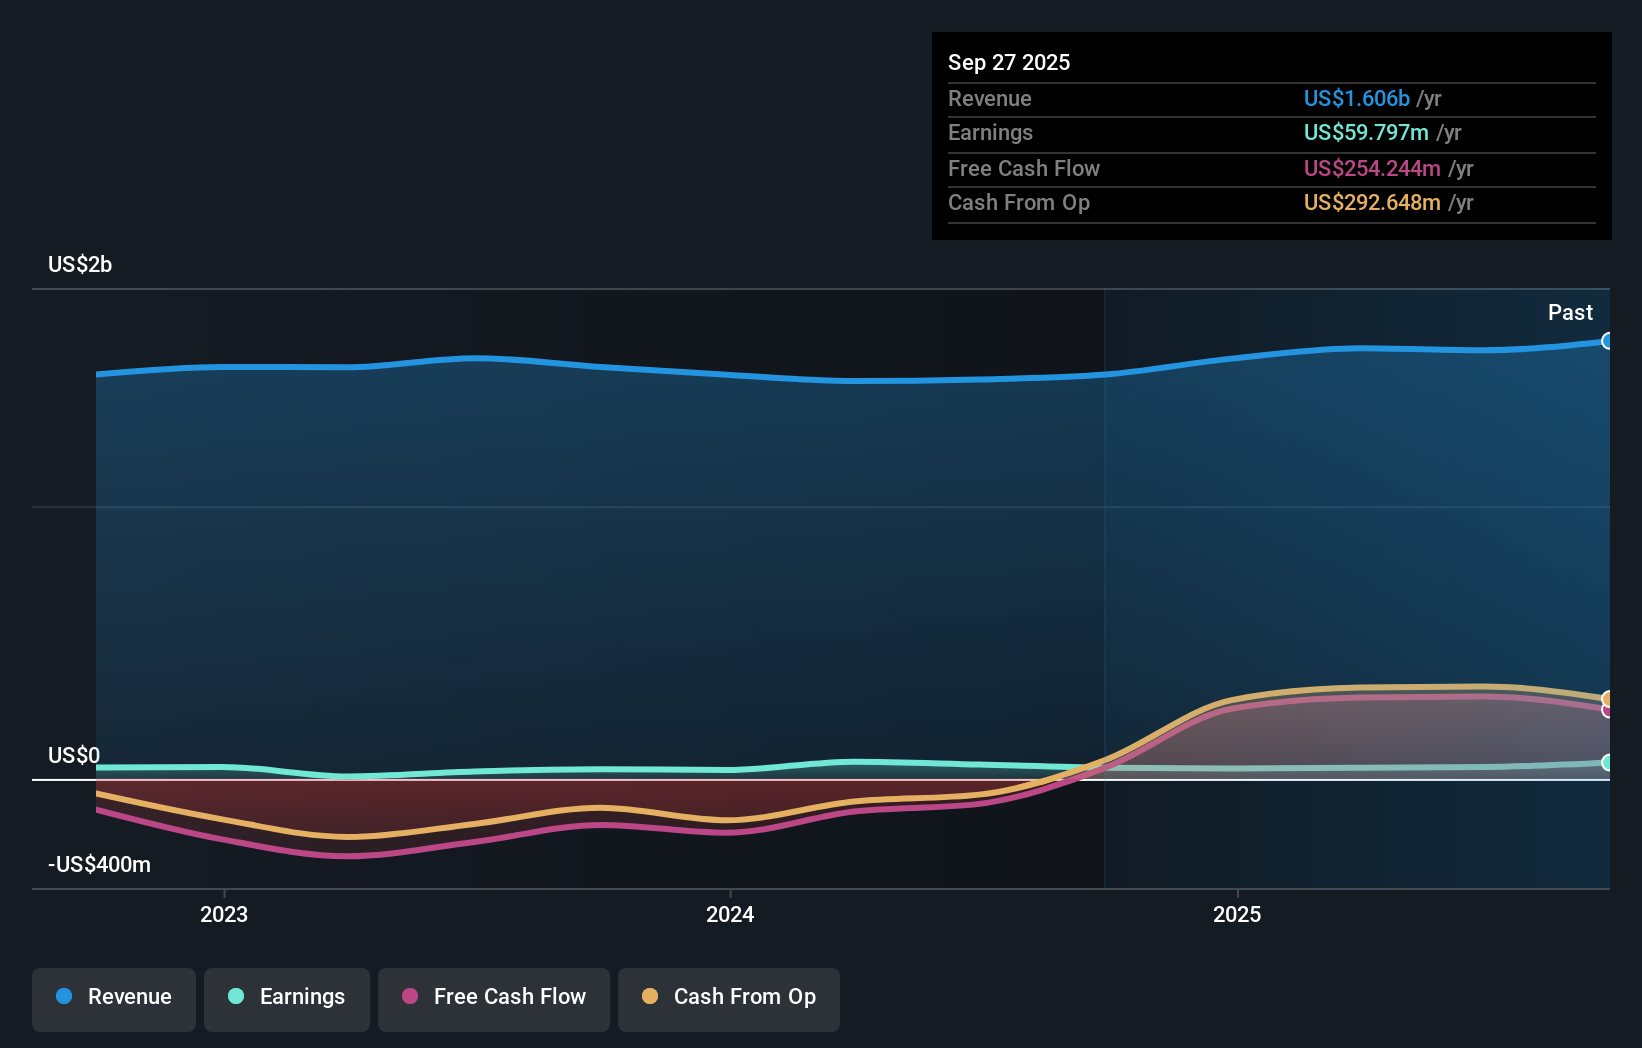
Overview: Seneca Foods Corporation is a company that specializes in providing packaged fruits and vegetables both domestically and internationally, with a market capitalization of approximately $1.02 billion.
Operations: With a market cap of approximately $1.02 billion, Seneca Foods generates revenue primarily from its Vegetable segment, which accounts for $1.47 billion, and its Fruit and Snack segment with $106.49 million in revenue.
Seneca Foods, a notable player in the food industry, has shown impressive earnings growth of 134.5% over the past year, far outpacing the industry's -1.1%. The company reported a net income of US$44.77 million for its recent quarter, compared to US$14.66 million a year ago, reflecting its robust performance. Trading at 48% below estimated fair value suggests potential undervaluation in the market. Despite an increase in debt-to-equity ratio from 19.5% to 38.6% over five years, it remains satisfactory at 34%. With high-quality earnings and free cash flow positivity, Seneca seems poised for continued strength in its sector.
Adams Natural Resources Fund (PEO)
Simply Wall St Value Rating: ★★★★★☆
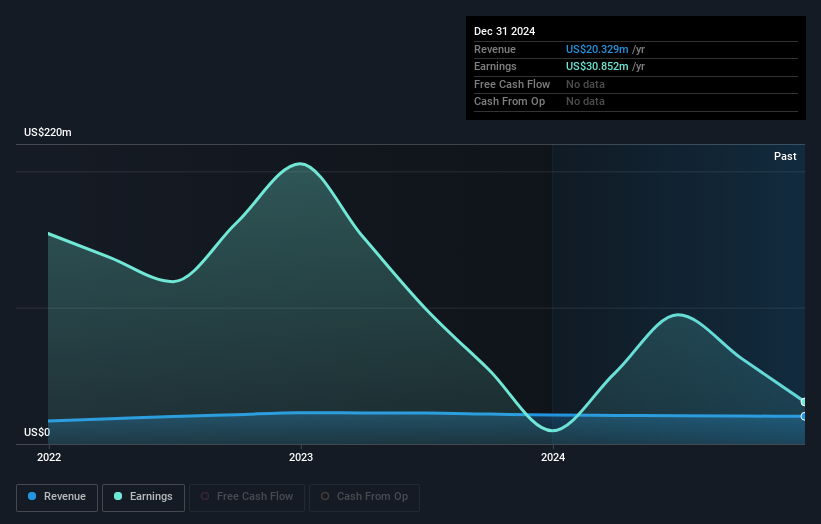
Overview: Adams Natural Resources Fund, Inc. is a publicly owned investment manager with a market capitalization of approximately $773.35 million.
Operations: The fund generates revenue primarily from its financial services segment, specifically through closed-end funds amounting to $20.29 million.
Adams Natural Resources Fund, a nimble player in the market, reported an impressive net income of US$54.76 million for 2025. This was bolstered by a significant one-off gain of US$37.5 million, which played a crucial role in its financial results. With earnings growth at 77.5% over the past year, it outpaced the Capital Markets industry average of 17.4%, showcasing robust performance despite its smaller size. The fund's price-to-earnings ratio stands attractively at 14.1x compared to the broader US market's 18.2x, suggesting potential value for investors seeking opportunities beyond mainstream options.
REX American Resources (REX)
Simply Wall St Value Rating: ★★★★★★
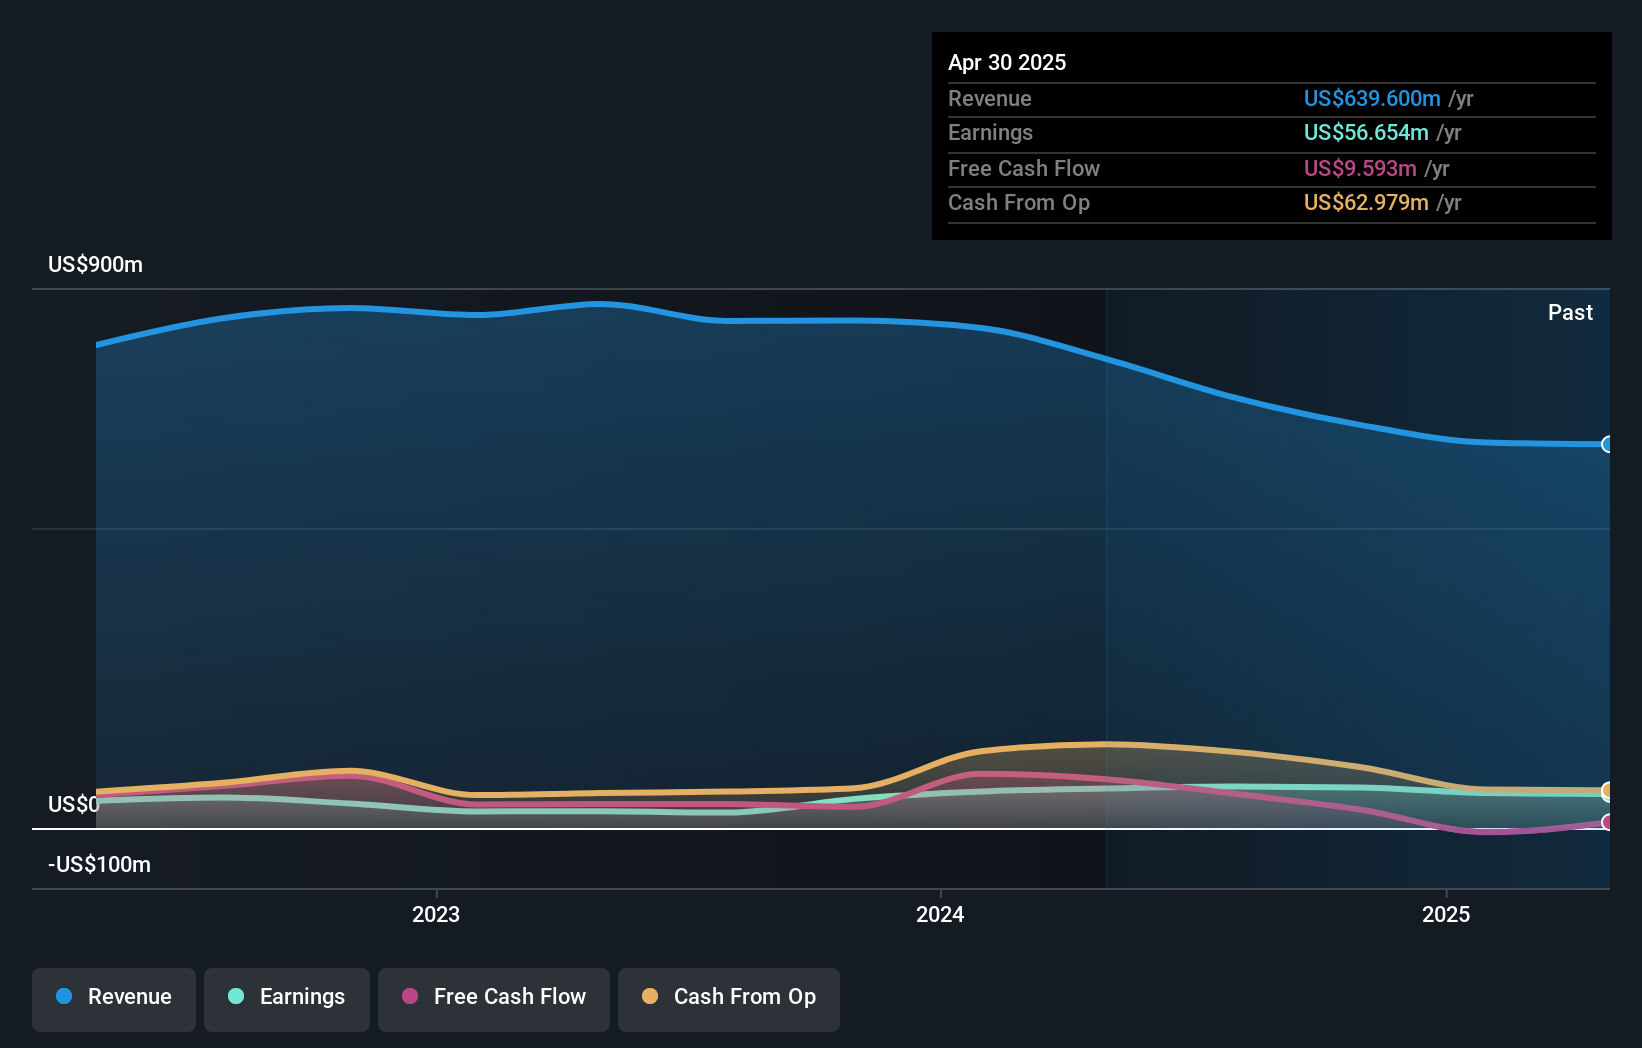
Overview: REX American Resources Corporation, along with its subsidiaries, is engaged in the production and sale of ethanol in the United States and has a market capitalization of approximately $1.57 billion.
Operations: REX generates revenue primarily from ethanol production and sales. The company's net profit margin has shown variability, reflecting changes in operating efficiency and market conditions.
REX American Resources, a player in the ethanol industry, is making waves with its strategic focus on carbon capture and facility expansions. Over the past year, earnings surged by 42.6%, outpacing the oil and gas sector's -2.5% performance. This debt-free company trades at 18.6% below its estimated fair value, showcasing high-quality earnings despite facing challenges like regulatory risks and cost pressures from logistics. Recent financials reveal net income of US$43.75 million for Q4 2026, up from US$11.1 million a year prior, with basic EPS rising to US$1.32 from US$0.31 during the same period last year.
Summing It All Up
- Navigate through the entire inventory of 333 US Undiscovered Gems With Strong Fundamentals here.
- Are you invested in these stocks already? Keep abreast of every twist and turn by setting up a portfolio with Simply Wall St, where we make it simple for investors like you to stay informed and proactive.
- Take control of your financial future using Simply Wall St, offering free, in-depth knowledge of international markets to every investor.
Searching for a Fresh Perspective?
- Explore high-performing small cap companies that haven't yet garnered significant analyst attention.
- Fuel your portfolio with companies showing strong growth potential, backed by optimistic outlooks both from analysts and management.
- Find companies with promising cash flow potential yet trading below their fair value.
This article by Simply Wall St is general in nature. We provide commentary based on historical data and analyst forecasts only using an unbiased methodology and our articles are not intended to be financial advice. It does not constitute a recommendation to buy or sell any stock, and does not take account of your objectives, or your financial situation. We aim to bring you long-term focused analysis driven by fundamental data. Note that our analysis may not factor in the latest price-sensitive company announcements or qualitative material. Simply Wall St has no position in any stocks mentioned.
Have feedback on this article? Concerned about the content? Get in touch with us directly. Alternatively, email editorial-team@simplywallst.com