
Why Cheniere Energy Partners Is Back in Focus
With Qatari LNG exports disrupted by the Iran war, Cheniere Energy Partners (CQP) is drawing fresh attention as its Corpus Christi facility ramps up production to meet urgent global demand for liquefied natural gas.
See our latest analysis for Cheniere Energy Partners.
The recent Iran war related disruption to Qatari LNG exports has coincided with a 20.7% 3 month share price return and a 68.2% 3 year total shareholder return, signalling strong momentum despite a 6.4% 1 day pullback to US$64.92.
If this LNG story has your attention, it could be a good moment to scan for other energy infrastructure names benefiting from global capacity shifts through our 89 nuclear energy infrastructure stocks
With a recent 20.2% year-to-date gain, a 1-year total return of 7.8% and a 3-year total return of 68.2%, yet trading around 25.5% above one intrinsic estimate and above the consensus price target, is there still a buying opportunity here or is the market already pricing in future growth?
Price to Earnings of 12.5x: Is It Justified?
Cheniere Energy Partners last closed at $64.92, and on a P/E of 12.5x it screens as good value compared with both peers and the broader US market.
The P/E multiple compares the current share price to earnings per share, so it gives a quick sense of how much investors are paying for each dollar of profit. For a capital intensive LNG export business, this is a common way to weigh current profitability against what the market is expecting ahead.
Here, the 12.5x P/E is below the US Oil and Gas industry average of 16.8x and below a peer average of 18.3x, which suggests the market is pricing CQP’s earnings at a discount. It also sits under an estimated “fair” P/E of 19.8x, a level the valuation work suggests the market could move toward if sentiment and fundamentals stayed aligned with that model.
Against that backdrop, the current P/E suggests investors are not paying a premium for CQP’s earnings power.
Explore the SWS fair ratio for Cheniere Energy Partners
Result: Price to Earnings of 12.5x (UNDERVALUED)
However, there are still clear watchpoints, including net income declining 3.1% annually and the recent 8.6% premium to analyst targets, which may limit upside.
Find out about the key risks to this Cheniere Energy Partners narrative.
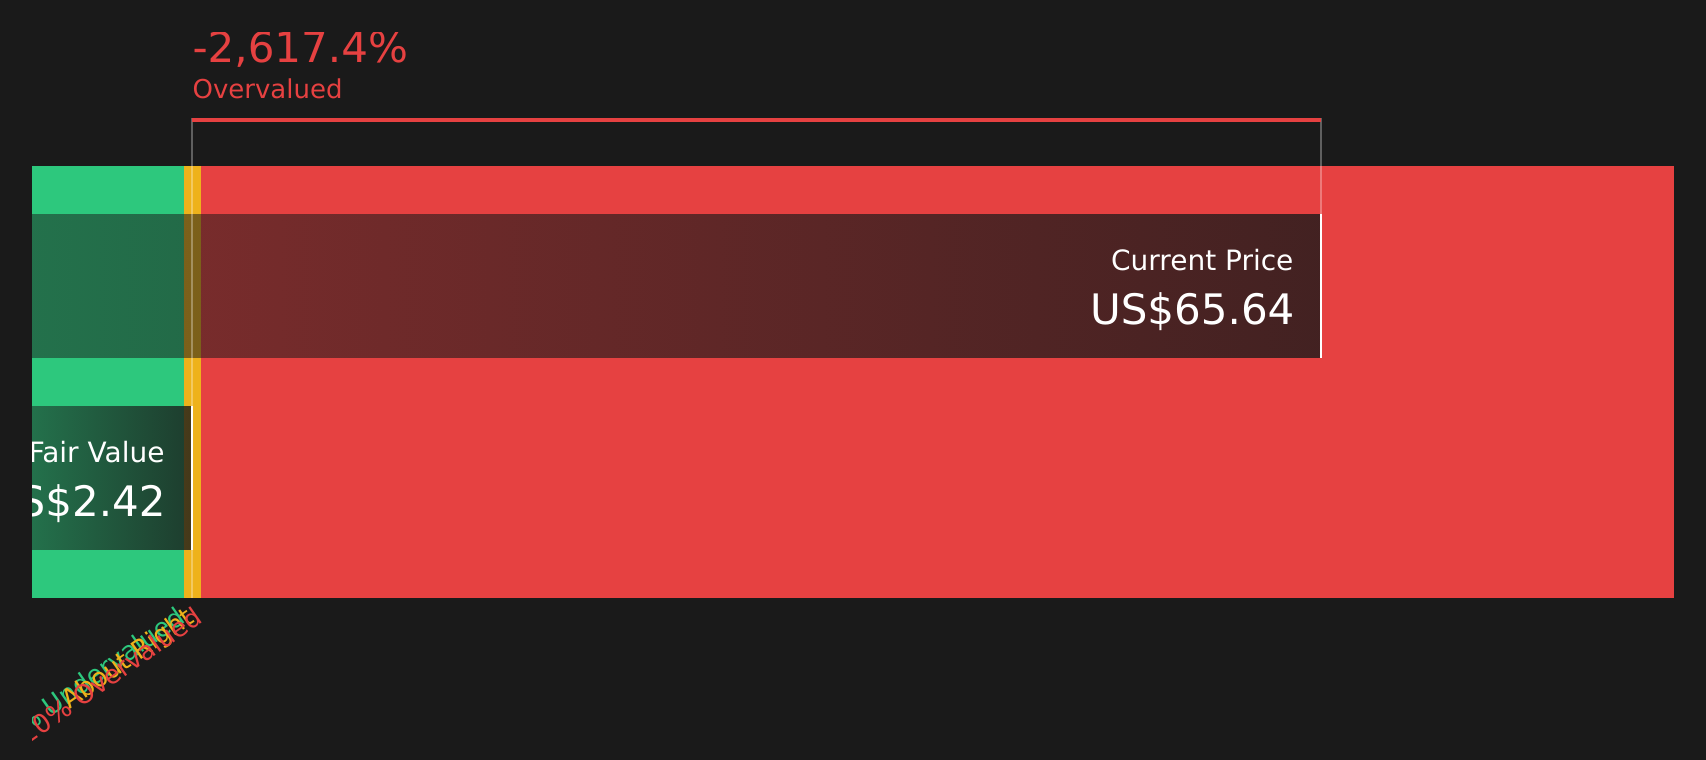
Another Way to Look at Value
While the 12.5x P/E hints at good value, the SWS DCF model paints a very different picture, with an estimated future cash flow value of $2.45 per unit versus the current $64.92 price. That comparison suggests CQP is trading well above this model. The question is which signal you view as more informative.
Look into how the SWS DCF model arrives at its fair value.
Simply Wall St performs a discounted cash flow (DCF) on every stock in the world every day (check out Cheniere Energy Partners for example). We show the entire calculation in full. You can track the result in your watchlist or portfolio and be alerted when this changes, or use our stock screener to discover 62 high quality undervalued stocks. If you save a screener we even alert you when new companies match - so you never miss a potential opportunity.
Next Steps
Mixed signals so far, with value, risk and reward all in the picture, mean this is a moment to check the numbers yourself and move quickly by weighing up the 3 key rewards and 3 important warning signs
Looking for more investment ideas?
If CQP has you thinking bigger, do not stop here. Broaden your watchlist with other focused ideas that could complement or contrast what you see in LNG.
- Target potential bargains by scanning companies that combine quality fundamentals with attractive pricing using the 62 high quality undervalued stocks.
- Strengthen your income stream by checking out businesses offering higher yields and resilient payouts through the 12 dividend fortresses.
- Prioritise resilience by reviewing companies with lower risk profiles and steadier financial characteristics via the 64 resilient stocks with low risk scores.
This article by Simply Wall St is general in nature. We provide commentary based on historical data and analyst forecasts only using an unbiased methodology and our articles are not intended to be financial advice. It does not constitute a recommendation to buy or sell any stock, and does not take account of your objectives, or your financial situation. We aim to bring you long-term focused analysis driven by fundamental data. Note that our analysis may not factor in the latest price-sensitive company announcements or qualitative material. Simply Wall St has no position in any stocks mentioned.
Have feedback on this article? Concerned about the content? Get in touch with us directly. Alternatively, email editorial-team@simplywallst.com