
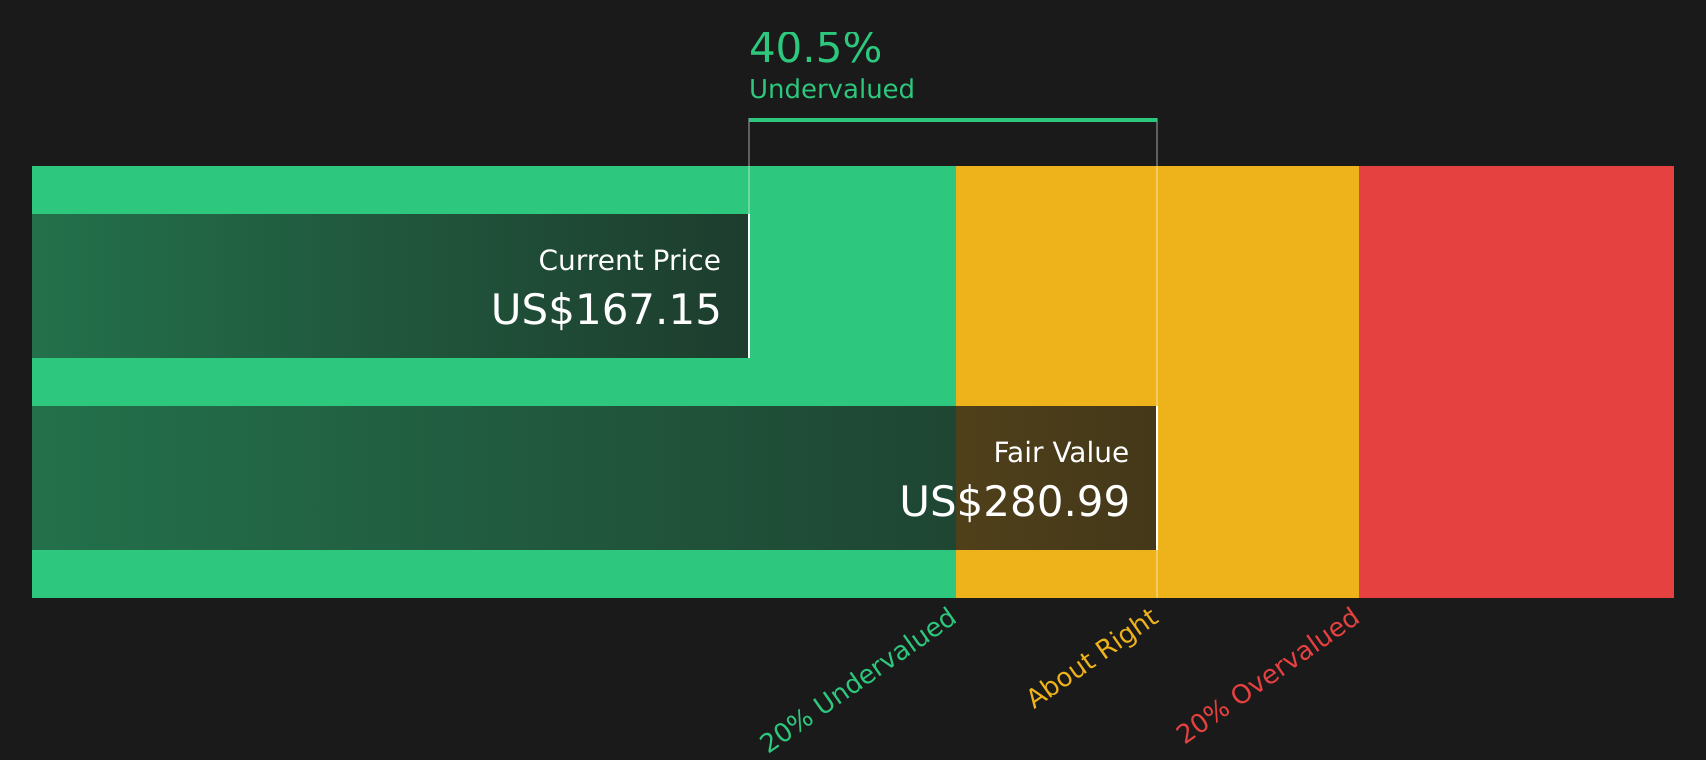
- If you are wondering whether Marsh & McLennan Companies at around US$169 is now a potential opportunity or a value trap, the key is to understand what the current price actually implies about the business.
- The stock has seen a 4.1% decline over the last 7 days, a 9.4% decline over 30 days and is down 29.0% over the past year, which may signal that the market is reassessing both its growth potential and risk profile.
- Recent coverage has focused on how the company is positioned within the broader insurance and professional services space, including its role in risk management and consulting for corporate clients. These themes provide context for why investors may be rethinking how much they are willing to pay for its future cash flows and resilience.
- Simply Wall St currently assigns Marsh & McLennan Companies a valuation score of 4 out of 6, reflecting where it appears undervalued on several checks and more demanding on others. The next sections will walk through the usual valuation tools before finishing with a different way to think about what the market is pricing in.
Approach 1: Marsh & McLennan Companies Excess Returns Analysis
The Excess Returns model looks at how much value Marsh & McLennan Companies creates over and above the return that equity investors require. Instead of focusing on near term earnings alone, it weighs the return on equity against the company’s book value and the cost of equity.
Here, the key inputs are a Book Value of $31.14 per share and a Stable EPS of $11.92 per share, based on weighted future return on equity estimates from 6 analysts. The implied Cost of Equity is $2.74 per share, which leaves an Excess Return of $9.18 per share. That is supported by an Average Return on Equity of 30.38% and a Stable Book Value estimate of $39.23 per share, based on forecasts from 4 analysts.
Using these inputs, the Excess Returns model produces an estimated intrinsic value of about $296.55 per share. Against a current share price around $169, this framework implies the stock trades at roughly a 43.0% discount, which points to material undervaluation on this measure.
Result: UNDERVALUED
Our Excess Returns analysis suggests Marsh & McLennan Companies is undervalued by 43.0%. Track this in your watchlist or portfolio, or discover 62 more high quality undervalued stocks.
Approach 2: Marsh & McLennan Companies Price vs Earnings
For profitable companies like Marsh & McLennan Companies, the P/E ratio is a useful way to think about what you are paying for each dollar of earnings. It reflects not only current profitability but also what the market is willing to pay given expectations for future earnings and the perceived risk of those earnings.
In general, higher growth expectations and lower perceived risk can justify a higher P/E ratio, while slower growth and higher risk usually line up with a lower, more conservative multiple. Marsh & McLennan Companies currently trades on a P/E of 19.69x. That sits above the Insurance industry average of 10.86x but below the peer group average of 22.77x. This suggests the market prices it at a premium to the broader industry, but not at the top end of its immediate peer set.
Simply Wall St’s Fair Ratio for Marsh & McLennan Companies is 14.35x. This is a proprietary estimate of what the P/E might look like given factors such as earnings growth, profit margins, size, risk profile and industry. Because it is tailored to the company’s own fundamentals, it can give a more targeted view than a simple comparison with industry or peer averages. Comparing the Fair Ratio of 14.35x with the actual P/E of 19.69x suggests the shares are pricing in a richer multiple than this framework supports.
Result: OVERVALUED

P/E ratios tell one story, but what if the real opportunity lies elsewhere? Start investing in legacies, not executives. Discover our 20 top founder-led companies.
Upgrade Your Decision Making: Choose your Marsh & McLennan Companies Narrative
Earlier it was mentioned that there is an even better way to understand valuation. Meet Narratives, a simple way for you to connect your view of Marsh & McLennan Companies with a financial forecast and a fair value. You can turn your assumptions about future revenue, earnings and margins into a story backed by numbers on Simply Wall St’s Community page, then compare that Fair Value with the current price to decide whether you see the stock as attractive or expensive. The platform automatically refreshes your Narrative when new earnings or news arrive. For example, one investor who focuses on AI as a productivity support tool and is comfortable with a higher future P/E might set a Fair Value closer to the bullish US$258 target, while another who is more cautious about softer pricing and disruption risk might anchor nearer the US$197 bearish target. Each investor uses the same company data but arrives at different, clearly framed decisions.
Do you think there's more to the story for Marsh & McLennan Companies? Head over to our Community to see what others are saying!

This article by Simply Wall St is general in nature. We provide commentary based on historical data and analyst forecasts only using an unbiased methodology and our articles are not intended to be financial advice. It does not constitute a recommendation to buy or sell any stock, and does not take account of your objectives, or your financial situation. We aim to bring you long-term focused analysis driven by fundamental data. Note that our analysis may not factor in the latest price-sensitive company announcements or qualitative material. Simply Wall St has no position in any stocks mentioned.
Have feedback on this article? Concerned about the content? Get in touch with us directly. Alternatively, email editorial-team@simplywallst.com