
- Earlier in March, Campbell's reported fiscal Q2 2026 results showing lower net sales and EBIT, as storms in January disrupted shipments and lifted supply chain costs.
- These results come amid two years of falling unit sales and a projected 2.6% sales decline over the next 12 months, underscoring demand pressure in Campbell's core categories.
- Next, we’ll examine how weaker demand and weather-related supply chain disruptions might reshape Campbell's previously outlined investment narrative.
Invest in the nuclear renaissance through our list of 89 elite nuclear energy infrastructure plays powering the global AI revolution.
Campbell's Investment Narrative Recap
To own Campbell’s today, you need to believe its core pantry brands and newer additions like Rao’s can still support steady cash generation despite demand pressure in processed foods. The latest Q2 miss, tied to storms and softer volumes, highlights that near term the key catalyst is restoring volume trends, while the biggest risk is that ongoing category weakness in soups and snacks keeps eroding organic sales. Weather disruptions look temporary, but they add stress to already thin margins.
The most relevant recent announcement here is Campbell’s March 11 Q2 and first half 2026 results, which showed lower net sales and EBIT alongside commentary on January storm impacts and higher supply chain costs. For investors, those numbers matter because they sit directly against the cost savings and supply chain optimization story that was expected to support margin resilience while volumes stayed under pressure.
Yet investors should be aware that if volume declines continue while input and logistics costs stay elevated, Campbell’s margin story could start to look very different...
Read the full narrative on Campbell's (it's free!)
Campbell's narrative projects $10.2 billion revenue and $868.6 million earnings by 2028. This assumes a 0.0% yearly revenue decline and a $266.6 million earnings increase from $602.0 million today.
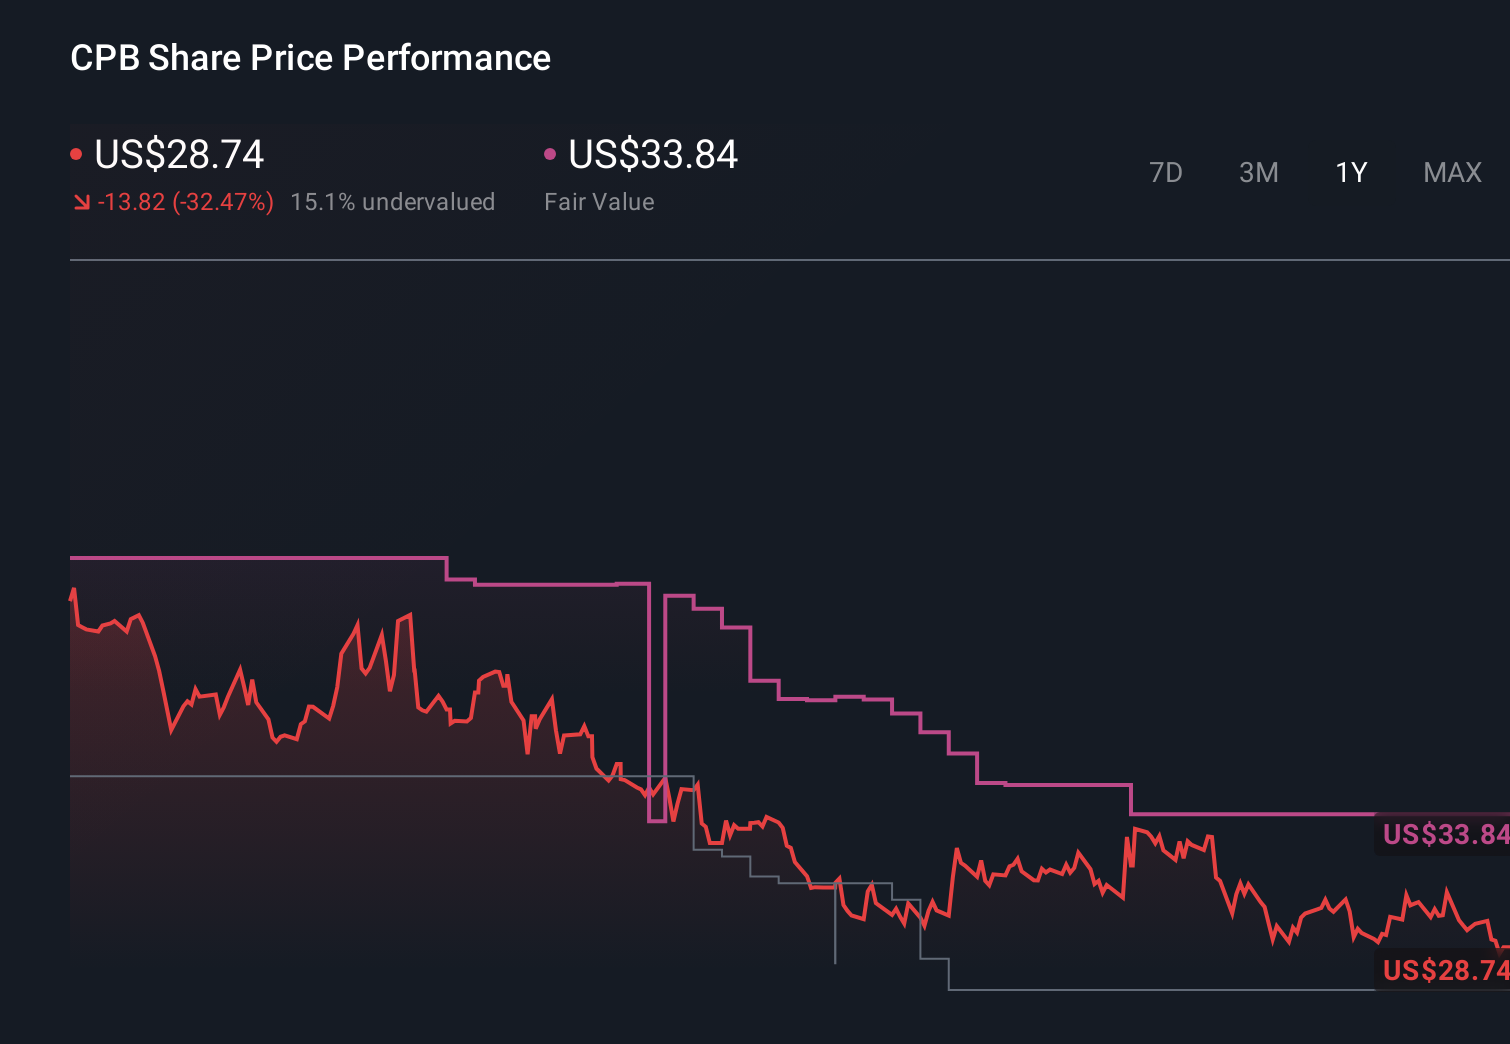
Uncover how Campbell's forecasts yield a $25.94 fair value, a 18% upside to its current price.
Exploring Other Perspectives
Before this Q2 setback, the most optimistic analysts were assuming revenue could reach about US$10.9 billion and earnings US$1.2 billion by 2028, which is far more upbeat than the baseline view and sharply contrasts with the current pressures on demand and margins.
Explore 8 other fair value estimates on Campbell's - why the stock might be worth over 2x more than the current price!
Decide For Yourself
Disagree with existing narratives? Extraordinary investment returns rarely come from following the herd, so go with your instincts.
- A great starting point for your Campbell's research is our analysis highlighting 5 key rewards and 3 important warning signs that could impact your investment decision.
- Our free Campbell's research report provides a comprehensive fundamental analysis summarized in a single visual - the Snowflake - making it easy to evaluate Campbell's overall financial health at a glance.
Want Some Alternatives?
Our top stock finds are flying under the radar-for now. Get in early:
- This technology could replace computers: discover 22 stocks that are working to make quantum computing a reality.
- We've uncovered the 12 dividend fortresses yielding 5%+ that don't just survive market storms, but thrive in them.
- Uncover the next big thing with 30 elite penny stocks that balance risk and reward.
This article by Simply Wall St is general in nature. We provide commentary based on historical data and analyst forecasts only using an unbiased methodology and our articles are not intended to be financial advice. It does not constitute a recommendation to buy or sell any stock, and does not take account of your objectives, or your financial situation. We aim to bring you long-term focused analysis driven by fundamental data. Note that our analysis may not factor in the latest price-sensitive company announcements or qualitative material. Simply Wall St has no position in any stocks mentioned.
Have feedback on this article? Concerned about the content? Get in touch with us directly. Alternatively, email editorial-team@simplywallst.com