
- Wondering whether Owens Corning shares around US$104.56 are offering value or risk at this point? This article walks through the key signals that can help you judge the price for yourself.
- The stock has had a mixed run, with a 4.6% gain over the last 7 days, a 15.3% decline over 30 days, and returns of 8.4% lower year to date and 24.9% lower over 1 year, alongside gains of 15.4% over 3 years and 21.9% over 5 years.
- Recent coverage of Owens Corning has focused on how market sentiment and sector conditions are feeding into the share price, highlighting both renewed interest from some investors and caution from others. These headlines help frame whether the recent pullback is seen as a reset in expectations or a reassessment of long term prospects.
- On Simply Wall St's valuation checks, Owens Corning scores 5 out of 6. The rest of this article will walk through what that means using different valuation methods, before finishing with a broader way to think about what the current price might be telling you.
Find out why Owens Corning's -24.9% return over the last year is lagging behind its peers.
Approach 1: Owens Corning Discounted Cash Flow (DCF) Analysis
A Discounted Cash Flow, or DCF, model looks at the cash Owens Corning is expected to generate in the future and then discounts those amounts back to what they might be worth in today’s dollars. It is essentially asking what a stream of future cash flows is worth right now.
For Owens Corning, the latest twelve month free cash flow is about $1,073.7 million. Analysts provide explicit estimates out to 2027, with free cash flow for that year projected at $873.0 million. Beyond that, Simply Wall St extrapolates the company’s cash flows out to 2035 using the 2 Stage Free Cash Flow to Equity model, with projected annual free cash flows in that period generally in the $700 million to $800 million range.
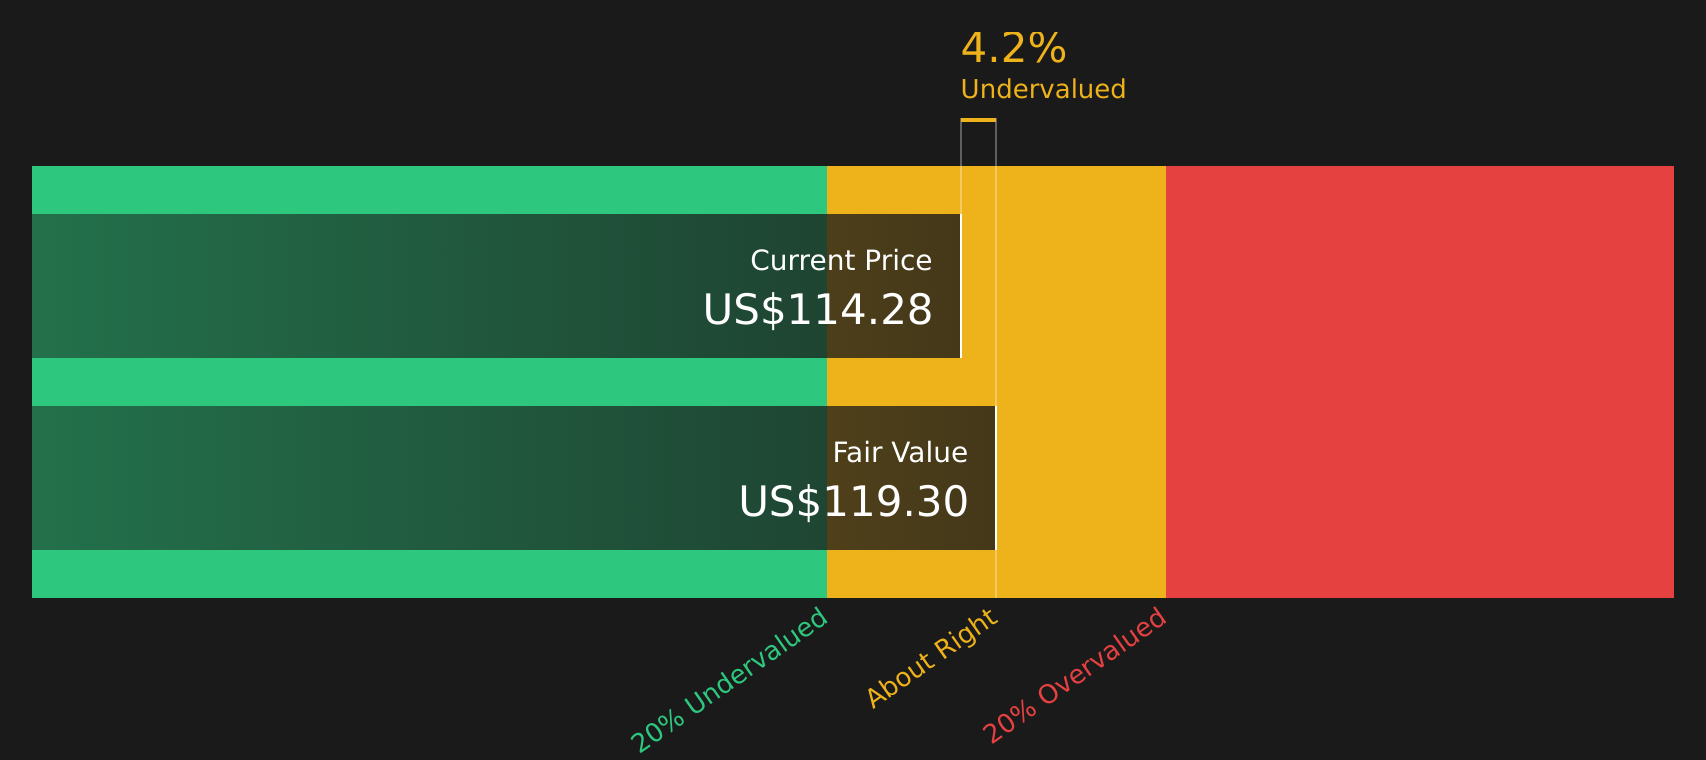
Bringing all those projected cash flows back to today using a discount rate gives an estimated intrinsic value of about $120.07 per share. Compared with the recent share price around $104.56, the model implies the stock is 12.9% undervalued on this set of assumptions.
Result: UNDERVALUED
Our Discounted Cash Flow (DCF) analysis suggests Owens Corning is undervalued by 12.9%. Track this in your watchlist or portfolio, or discover 61 more high quality undervalued stocks.
Approach 2: Owens Corning Price vs Sales
For companies with established revenues, the P/S ratio can be a useful way to compare what investors are paying for each dollar of sales, especially when earnings figures are affected by one off items or accounting choices.
In general, higher growth expectations and lower perceived risk tend to support a higher P/S multiple, while slower expected growth or higher risk usually line up with a lower, more cautious range. So it helps to compare Owens Corning’s current P/S with relevant reference points.
Owens Corning is trading on a P/S ratio of 0.83x. That sits below the Building industry average of 1.93x and also below the peer group average of 3.50x. Simply Wall St’s Fair Ratio for Owens Corning is 1.54x. This proprietary metric estimates what a reasonable P/S might be after adjusting for factors such as earnings growth profile, industry, profit margins, company size and specific risks.
Because the Fair Ratio is tailored to Owens Corning’s characteristics, it can provide a more focused reference point than broad industry or peer comparisons. With the current P/S of 0.83x versus the Fair Ratio of 1.54x, the shares screen as undervalued on this measure.
Result: UNDERVALUED

P/S ratios tell one story, but what if the real opportunity lies elsewhere? Start investing in legacies, not executives. Discover our 20 top founder-led companies.
Upgrade Your Decision Making: Choose your Owens Corning Narrative
Earlier it was mentioned that there is an even better way to understand valuation. Narratives let you spell out your story for Owens Corning by linking your view on its future revenue, earnings and margins to a forecast and a fair value, then comparing that to the current price. All of this happens within a simple tool on Simply Wall St’s Community page that updates as new news or earnings arrive, so you can see, for example, how a more optimistic view that lines up with a Fair Value near US$166, or a more cautious view closer to US$110, leads to very different conclusions about whether the current price looks high or low.
Do you think there's more to the story for Owens Corning? Head over to our Community to see what others are saying!

This article by Simply Wall St is general in nature. We provide commentary based on historical data and analyst forecasts only using an unbiased methodology and our articles are not intended to be financial advice. It does not constitute a recommendation to buy or sell any stock, and does not take account of your objectives, or your financial situation. We aim to bring you long-term focused analysis driven by fundamental data. Note that our analysis may not factor in the latest price-sensitive company announcements or qualitative material. Simply Wall St has no position in any stocks mentioned.
Have feedback on this article? Concerned about the content? Get in touch with us directly. Alternatively, email editorial-team@simplywallst.com