
With American Tower trading at US$167.27, many investors are asking a simple question: does this price reflect the real value of the business, or is the market mispricing it right now?
Recent share price moves have raised that question even more, with the stock showing a 7.4% decline over the past week, a 12.0% decline over the past month, a 4.3% decline year to date, and a 17.6% decline over the last year.
Alongside these moves, ongoing attention on interest rate trends, real estate investment trusts and tower infrastructure companies has kept American Tower in focus for investors assessing income, growth and balance sheet resilience. These themes help explain why sentiment can swing quickly, even when the underlying business model is relatively well known.
Against that backdrop, American Tower currently holds a value score of 5/6. This suggests that most of the valuation checks used here point to the shares being priced below what those methods indicate. Next comes a closer look at those valuation approaches, along with a different way to think about value at the end of the article.
Find out why American Tower's -17.6% return over the last year is lagging behind its peers.
Approach 1: American Tower Discounted Cash Flow (DCF) Analysis
A Discounted Cash Flow, or DCF, model estimates what a company could be worth by projecting its future adjusted funds from operations and discounting those cash flows back to today using a required return.
For American Tower, the model uses a 2 stage Free Cash Flow to Equity approach based on adjusted funds from operations. The latest twelve month free cash flow is about $5.0b. Analyst inputs and extrapolated figures suggest projected free cash flow of about $6.6b by 2030, with a detailed path of annual forecasts and later estimates supplied by Simply Wall St for the 10 year horizon.
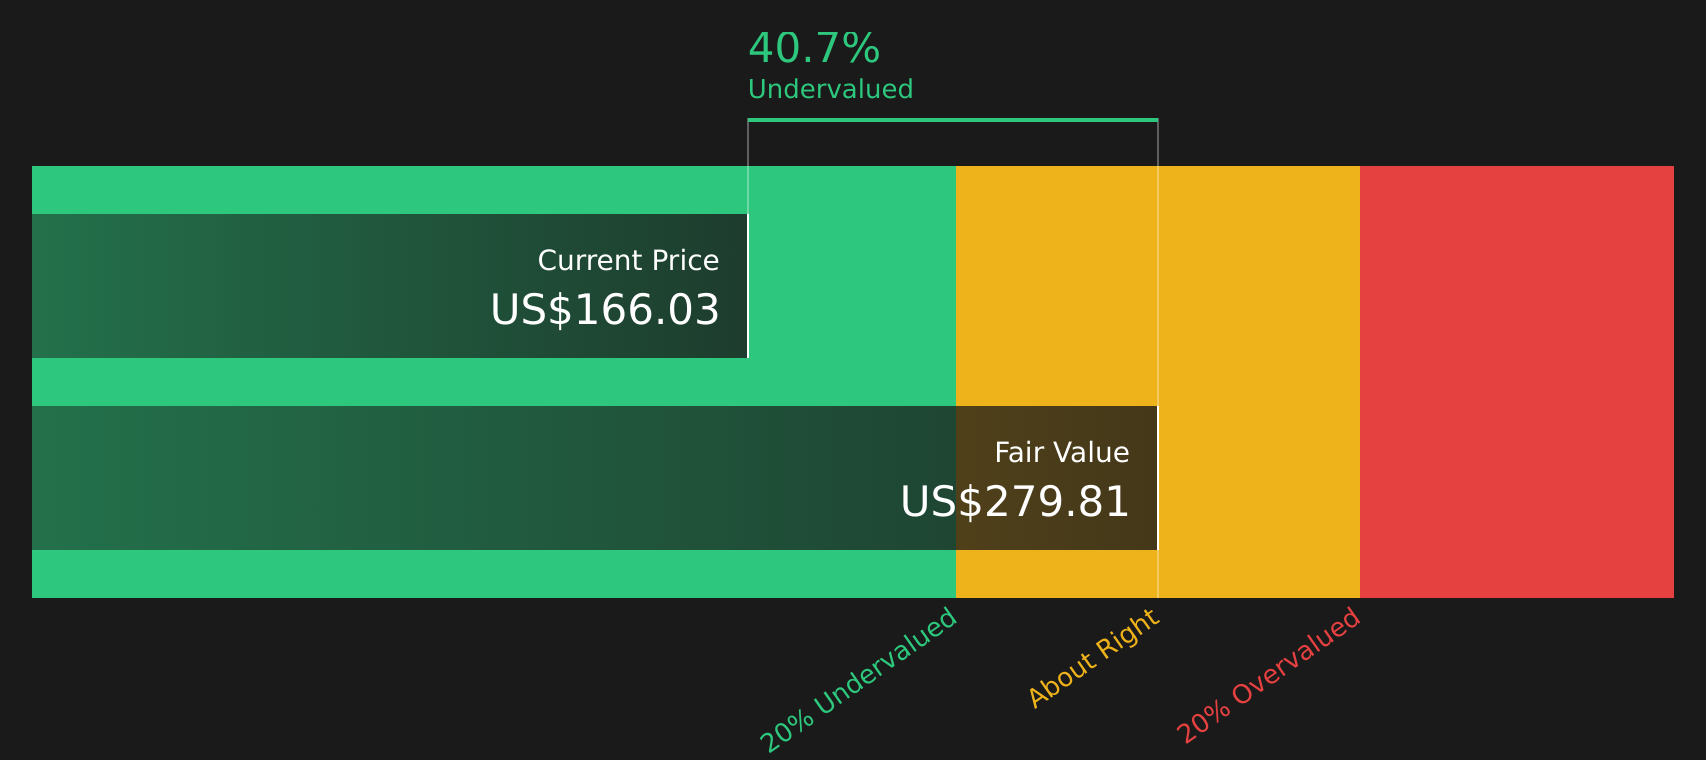
When all those future cash flows are discounted back, the model arrives at an estimated intrinsic value of US$265.85 per share. Compared to the current share price of US$167.27, this implies a 37.1% discount. Within this DCF framework, the shares are trading below the value indicated by the model.
Result: UNDERVALUED
Our Discounted Cash Flow (DCF) analysis suggests American Tower is undervalued by 37.1%. Track this in your watchlist or portfolio, or discover 55 more high quality undervalued stocks.
Approach 2: American Tower Price vs Earnings
For profitable companies, the P/E ratio is a useful way to see how much investors are paying for each dollar of current earnings. A higher P/E often reflects expectations of stronger growth or lower perceived risk, while a lower P/E can point to more modest growth assumptions or higher risk.
American Tower currently trades on a P/E of 30.82x. That sits above the Specialized REITs industry average of 15.49x, but below the peer group average of 41.28x. To refine this comparison, Simply Wall St uses a proprietary “Fair Ratio” of 35.13x. This aims to estimate a more tailored P/E for American Tower by incorporating factors such as its earnings growth profile, industry, profit margins, market cap and specific risks, rather than relying only on broad industry or peer averages.
Because the Fair Ratio is designed around American Tower’s own characteristics, it can give a more company specific anchor than simple benchmark comparisons. With the current P/E of 30.82x below the Fair Ratio of 35.13x, this framework indicates the shares are trading below the P/E level implied by these inputs.
Result: UNDERVALUED on this measure

P/E ratios tell one story, but what if the real opportunity lies elsewhere? Start investing in legacies, not executives. Discover our 20 top founder-led companies.
Upgrade Your Decision Making: Choose your American Tower Narrative
Earlier it was mentioned that there is an even better way to understand valuation. Meet Narratives, a simple framework where you set the story for American Tower, connect that story to your assumptions for future revenue, earnings and margins, and see how that flows through to a fair value that you can compare with the current share price. All of this is available within the Narratives feature on Simply Wall St’s Community page, which updates as new news or earnings arrive. One investor might see American Tower as a steady cash flow REIT with a higher fair value, while another treats it as a slower growth income play with a lower fair value, even though both are looking at the same underlying business.
Do you think there's more to the story for American Tower? Head over to our Community to see what others are saying!

This article by Simply Wall St is general in nature. We provide commentary based on historical data and analyst forecasts only using an unbiased methodology and our articles are not intended to be financial advice. It does not constitute a recommendation to buy or sell any stock, and does not take account of your objectives, or your financial situation. We aim to bring you long-term focused analysis driven by fundamental data. Note that our analysis may not factor in the latest price-sensitive company announcements or qualitative material. Simply Wall St has no position in any stocks mentioned.
Have feedback on this article? Concerned about the content? Get in touch with us directly. Alternatively, email editorial-team@simplywallst.com