
- If you are wondering whether V.F at around US$16.94 is a bargain or a value trap, the starting point is understanding what the current market price is really paying for.
- The share price is up 5.7% over the last 7 days, while the 30 day return sits at a 20.2% decline and the 1 year return is 2.0%, so the stock has recently shown mixed signals around both risk and recovery potential.
- These moves come against a backdrop of ongoing attention on V.F as a branded apparel group, including coverage of its efforts to reposition well known labels and respond to shifting consumer preferences. Investors have also been watching how the business responds to cost pressures and the broader retail spending backdrop, which can influence sentiment even without fresh earnings headlines.
- Right now, V.F has a valuation score of 2 out of 6, which means only two of six valuation checks currently flag the shares as undervalued. The next step is to look at how different valuation methods frame that score and then finish with a clearer way to piece the full valuation story together.
V.F scores just 2/6 on our valuation checks. See what other red flags we found in the full valuation breakdown.
Approach 1: V.F Discounted Cash Flow (DCF) Analysis
A Discounted Cash Flow model looks at the cash V.F is expected to generate in the future and discounts those projected cash flows back to today to estimate what the business might be worth per share right now.
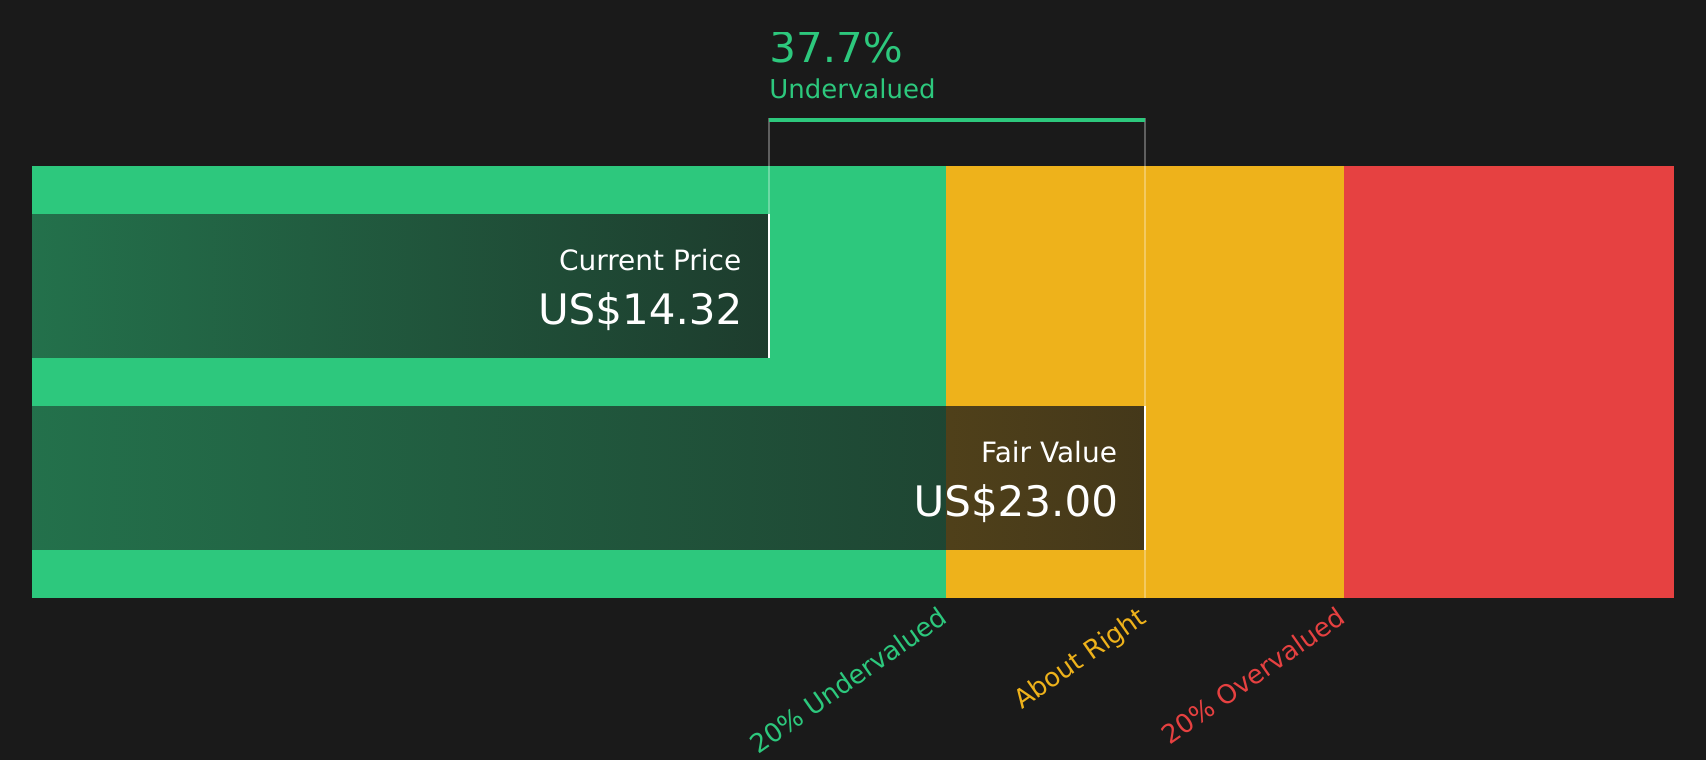
For V.F, the latest twelve month Free Cash Flow sits at about $303.7 million. Analysts provide detailed estimates for the next few years and Simply Wall St extends those projections further out, using a 2 Stage Free Cash Flow to Equity approach. Under this framework, V.F's Free Cash Flow is projected to be $674.7 million in 2028, with additional estimates running through to 2035, all expressed in dollars and then discounted to today using a required return.
When all those discounted cash flows are added together, the DCF model arrives at an intrinsic value of about $23.20 per share. Against the recent share price of around $16.94, that implies the stock trades at roughly a 27.0% discount. This indicates the market is pricing in more caution than this cash flow model does.
Result: UNDERVALUED
Our Discounted Cash Flow (DCF) analysis suggests V.F is undervalued by 27.0%. Track this in your watchlist or portfolio, or discover 55 more high quality undervalued stocks.
Approach 2: V.F Price vs Earnings
For a company that is generating profits, the P/E ratio is a useful quick check because it tells you how many dollars you are paying for each dollar of earnings. It tends to sit higher for businesses where investors accept more risk or expect stronger earnings growth, and lower where expectations are more muted.
V.F currently trades on a P/E of about 29.60x. That is above both the Luxury industry average P/E of roughly 18.33x and the broader peer group average of about 14.10x, so the market is paying a richer earnings multiple for this stock than for those benchmarks.
Simply Wall St also calculates a proprietary “Fair Ratio” for V.F of 27.21x. This is designed to be a more tailored anchor than simple peer or industry comparisons because it incorporates factors such as the company’s earnings growth profile, its industry, profit margins, market cap and specific risk characteristics. Comparing the current P/E of 29.60x with the Fair Ratio of 27.21x suggests the shares are pricing in a higher multiple than this framework would point to, which leans toward the stock looking overvalued on this metric.
Result: OVERVALUED

P/E ratios tell one story, but what if the real opportunity lies elsewhere? Start investing in legacies, not executives. Discover our 20 top founder-led companies.
Upgrade Your Decision Making: Choose your V.F Narrative
Earlier it was mentioned that there is an even better way to understand valuation, so Narratives are introduced here as a simple way for you to attach a clear story about V.F to the numbers you care about. This links your view on future revenue, earnings and margins to a Fair Value estimate that can be compared with the current share price on Simply Wall St's Community page. On that page, Narratives are updated automatically as new news or earnings arrive, and different investors can sit at opposite ends of the current V.F range. One Narrative may see Fair Value closer to the higher analyst target of US$40.00, and another closer to the lower US$10.00 view. This gives you a structured way to decide whether the price looks high or low relative to the story you find most convincing.
For V.F however we will make it really easy for you with previews of two leading V.F Narratives:
First up is the bullish case, which assumes a more optimistic outcome for the brands and the balance sheet.
Fair Value in this bullish narrative: US$31.42 per share.
At the recent price of US$16.94, the shares sit about 46% below that narrative fair value, using the difference relative to the fair value estimate.
Revenue growth assumption in this view: roughly 3.45% a year.
- Assumes cost transformation and a digital led direct to consumer push support higher margins and more resilient cash generation across the portfolio.
- Builds in steady revenue growth, with brands like The North Face and Timberland contributing meaningfully if premium and lifestyle ranges scale as expected.
- Requires confidence that by 2028 V.F can lift earnings, hold a P/E above the broader US Luxury industry, and justify a fair value well above the current share price.
On the other side is a more cautious view that focuses on execution risk and the possibility that the current price already bakes in generous expectations.
Fair Value in this bearish narrative: US$14.00 per share.
At the recent price of US$16.94, the shares sit about 17% above that narrative fair value, using the difference relative to the fair value estimate.
Revenue trend assumption in this view: around a 0.53% annual decline.
- Frames Vans, The North Face and Timberland as facing structural brand and demand pressure, with discounting and competitive intensity weighing on margins.
- Builds in a mild revenue decline and only modest margin improvement, which feeds through to lower earnings and a compressed P/E multiple by 2028.
- Assumes investors eventually apply a lower valuation to V.F if brand fatigue persists and cost and regulatory pressures keep profitability in check.
Together, these Narratives give you clear goalposts around what needs to happen on revenue, margins and valuation for V.F to look cheap or expensive at today’s price, so you can decide which story, if either, lines up with your own view of the stock.
Do you think there's more to the story for V.F? Head over to our Community to see what others are saying!

This article by Simply Wall St is general in nature. We provide commentary based on historical data and analyst forecasts only using an unbiased methodology and our articles are not intended to be financial advice. It does not constitute a recommendation to buy or sell any stock, and does not take account of your objectives, or your financial situation. We aim to bring you long-term focused analysis driven by fundamental data. Note that our analysis may not factor in the latest price-sensitive company announcements or qualitative material. Simply Wall St has no position in any stocks mentioned.
Have feedback on this article? Concerned about the content? Get in touch with us directly. Alternatively, email editorial-team@simplywallst.com