
What recent price moves suggest about Nelnet
Nelnet (NNI) has seen its share price ease, with a 0.8% decline over the past day and softer performance over the week, month, and past 3 months, putting recent returns in focus for investors.
See our latest analysis for Nelnet.
While the recent share price return over the past quarter has been weaker, the 1 year total shareholder return of 12.33% and 5 year total shareholder return of 82.47% point to a much stronger longer term picture.
If you are comparing Nelnet with other opportunities in the market, it can be useful to widen the lens and check out 20 top founder-led companies
With Nelnet shares easing recently but sitting on a 12.33% 1 year total return and a 5 year gain of 82.47%, the key question is whether the current price still leaves upside or if the market already reflects future growth.
Preferred P/E of 10.6x: Is it justified?
Nelnet's current valuation sits on a P/E of 10.6x, and when you line that up against peers, the stock screens as relatively expensive on earnings.
The P/E multiple compares the share price to earnings per share and is a quick way to see how much investors pay for each dollar of profit. For a diversified financial business like Nelnet, where earnings can swing with credit conditions and funding costs, this yardstick helps you see whether the market is placing a richer or more cautious price on those earnings.
Here, the picture is mixed. On one hand, Nelnet's P/E of 10.6x sits below the broader US market average of 18.1x, which suggests the shares are not priced like a high growth story. On the other hand, that same 10.6x level is higher than both the US Consumer Finance industry average of 7.8x and the peer group average of 8.7x, which means the market is assigning Nelnet a premium compared to closer comparables.
Put simply, the current earnings multiple looks more demanding than sector and peer averages, even if it sits under the wider US market level. Investors may want to consider what is driving that premium.
See what the numbers say about this price — find out in our valuation breakdown.
Result: Price-to-earnings of 10.6x (OVERVALUED).
However, that premium could be challenged if loan servicing volumes soften, or if Nelnet Bank and the asset management businesses face more volatile credit conditions.
Find out about the key risks to this Nelnet narrative.
Another view using our DCF model
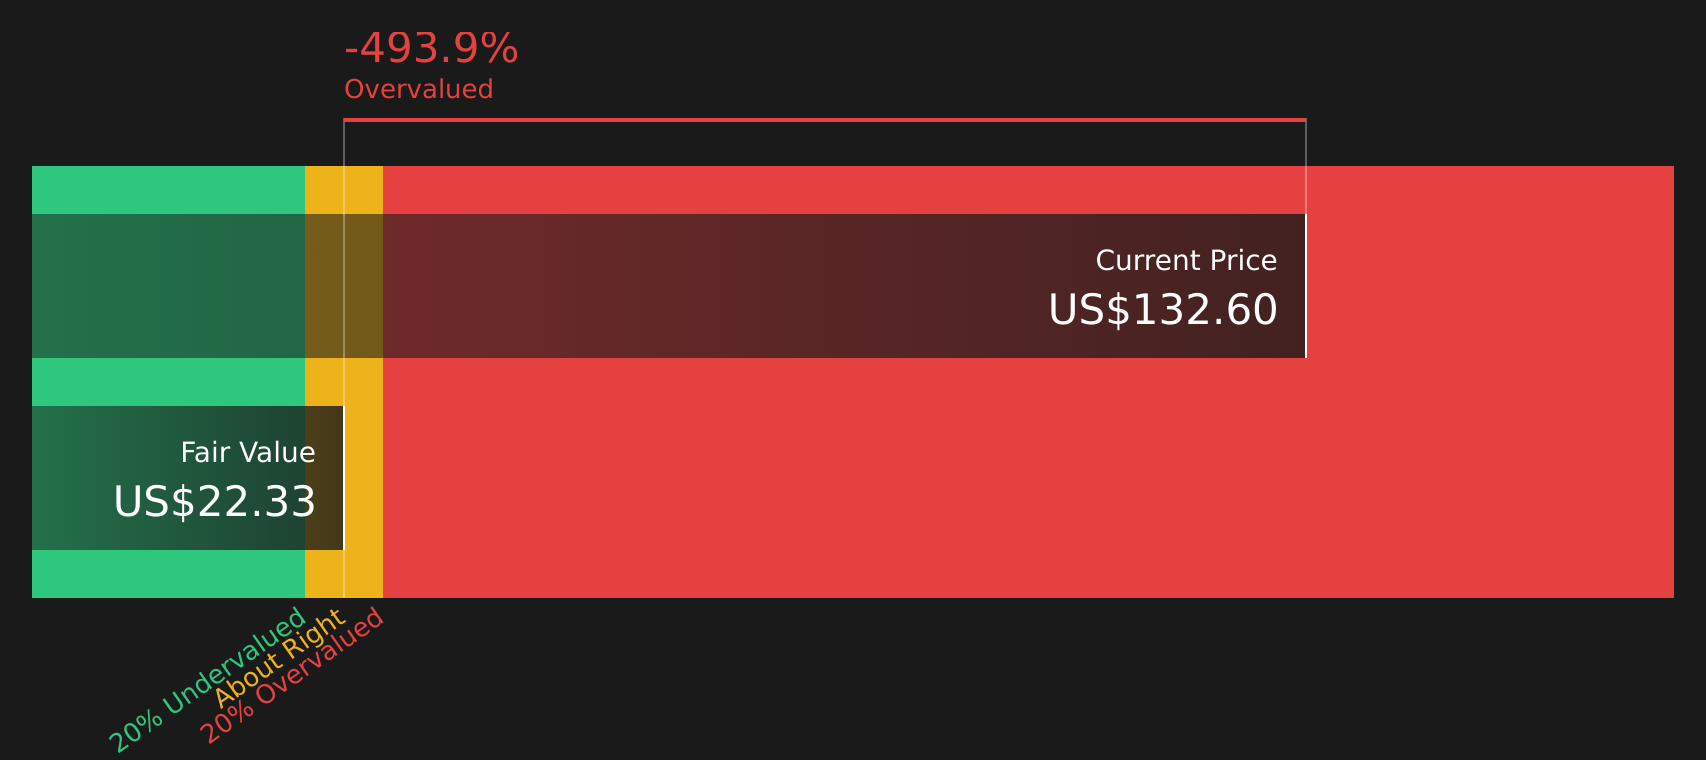
While the P/E of 10.6x suggests Nelnet trades at a premium to its Consumer Finance peers, our DCF model points the other way. With an estimated future cash flow value of $22.62 per share versus a market price of $126.68, the shares screen as expensive on this framework too. Which signal should matter more for you right now?
Look into how the SWS DCF model arrives at its fair value.
Simply Wall St performs a discounted cash flow (DCF) on every stock in the world every day (check out Nelnet for example). We show the entire calculation in full. You can track the result in your watchlist or portfolio and be alerted when this changes, or use our stock screener to discover 54 high quality undervalued stocks. If you save a screener we even alert you when new companies match - so you never miss a potential opportunity.
Next Steps
Mixed signals on valuation and sentiment so far? Take a closer look at the numbers, weigh the trade off between risks and rewards, and review the following: 2 key rewards and 2 important warning signs
Looking for more investment ideas?
If you stop with just one stock, you may miss opportunities that suit your goals better, so take a few minutes to scan wider across the market.
- Target potential value opportunities by checking companies that currently screen as 54 high quality undervalued stocks based on their fundamentals and pricing.
- Prioritise resilient balance sheets by reviewing companies in the solid balance sheet and fundamentals stocks screener (39 results) to see which ones line up with your risk comfort.
- Spot lesser known opportunities by scanning the screener containing 26 high quality undiscovered gems that combine quality fundamentals with relatively low attention.
This article by Simply Wall St is general in nature. We provide commentary based on historical data and analyst forecasts only using an unbiased methodology and our articles are not intended to be financial advice. It does not constitute a recommendation to buy or sell any stock, and does not take account of your objectives, or your financial situation. We aim to bring you long-term focused analysis driven by fundamental data. Note that our analysis may not factor in the latest price-sensitive company announcements or qualitative material. Simply Wall St has no position in any stocks mentioned.
Have feedback on this article? Concerned about the content? Get in touch with us directly. Alternatively, email editorial-team@simplywallst.com