
- Wondering whether Marsh & McLennan Companies at around US$176 a share is offering value or asking too much is exactly the question this breakdown aims to help you think through.
- The stock has slipped by 3.3% year to date and 22.7% over the last year, even though it is 58.2% higher over five years and 15.1% higher over three years, so the current price sits against a mixed return backdrop.
- Recent coverage has focused on Marsh & McLennan Companies as a major global insurance broker and risk advisor, with investors watching how the business responds to client demand for risk management and advisory services across changing conditions. Commentary has also highlighted how established players in insurance and consulting can react when sentiment around financial and professional services shifts.
- On Simply Wall St's 6 point valuation framework, Marsh & McLennan Companies currently scores 3 out of 6. The next sections will walk through familiar tools like P/E and DCF, then finish with a more holistic way to think about what that score really means for you.
Approach 1: Marsh & McLennan Companies Excess Returns Analysis
The Excess Returns model looks at how much profit a company is expected to earn above the return that equity investors typically require, then links that to today’s share price. Instead of focusing on cash flows, it asks whether the business earns enough on its equity base to justify its valuation.
For Marsh & McLennan Companies, book value is $31.14 per share and stable EPS is estimated at $11.48 per share, based on future Return on Equity estimates from 7 analysts. With a cost of equity of $2.69 per share, this implies an excess return of $8.79 per share. The average Return on Equity used in the model is 29.79%, and stable book value is projected at $38.53 per share, based on estimates from 5 analysts.
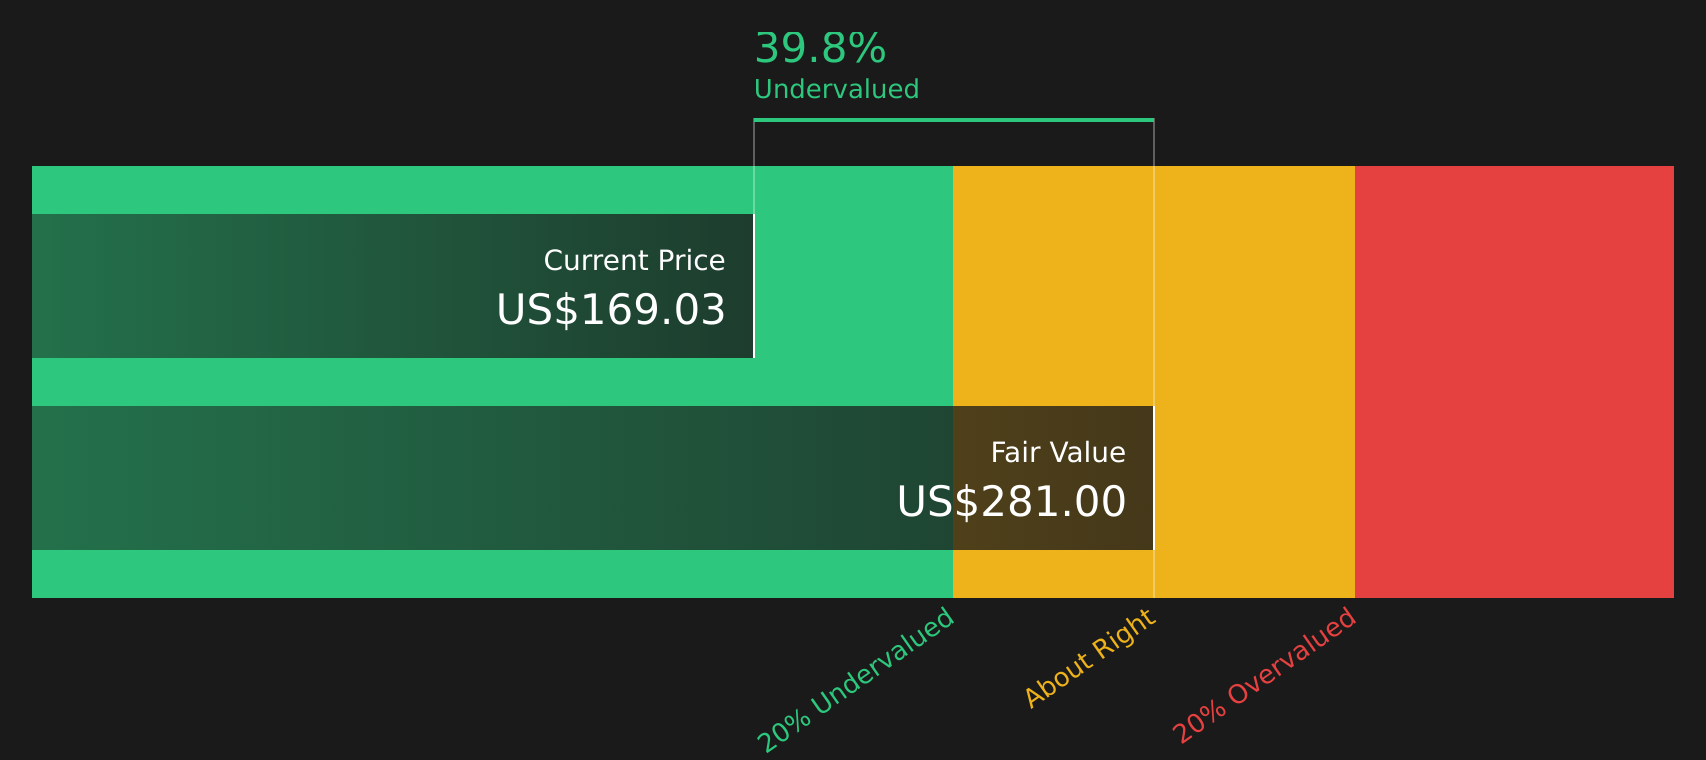
Feeding these inputs into the Excess Returns framework gives an estimated intrinsic value of about $284.86 per share. Compared with the current share price of around $176, the model indicates that Marsh & McLennan Companies is 38.0% undervalued on this basis.
Result: UNDERVALUED
Our Excess Returns analysis suggests Marsh & McLennan Companies is undervalued by 38.0%. Track this in your watchlist or portfolio, or discover 52 more high quality undervalued stocks.
Approach 2: Marsh & McLennan Companies Price vs Earnings
P/E is a common way to think about value for profitable companies because it links what you pay per share to the earnings that each share generates. A higher or lower P/E can make sense depending on how the market views a company’s growth prospects and risk profile, so there is no single “right” number that fits every business.
For Marsh & McLennan Companies, the current P/E is 20.54x. That sits above the Insurance industry average of 10.79x but below the peer group average of 23.72x. On its own, that indicates the market values Marsh & McLennan more highly than the broader industry, but not as highly as some direct peers.
Simply Wall St’s Fair Ratio for the stock is 14.37x. This is a proprietary estimate of what the P/E might be based on factors such as earnings growth, profit margins, risk profile, market cap and the Insurance industry context. Because it adjusts for these company specific traits, the Fair Ratio can be a more tailored yardstick than a simple comparison with industry or peers. With the current P/E of 20.54x versus a Fair Ratio of 14.37x, the shares screen as trading above that modelled “fair” level.
Result: OVERVALUED

P/E ratios tell one story, but what if the real opportunity lies elsewhere? Start investing in legacies, not executives. Discover our 20 top founder-led companies.
Upgrade Your Decision Making: Choose your Marsh & McLennan Companies Narrative
Earlier it was mentioned that there is an even better way to understand valuation. On Simply Wall St this comes through Narratives, which let you set a clear story for Marsh & McLennan Companies, link that story to your own revenue, earnings and margin assumptions, turn those into a Fair Value, then compare that Fair Value with the current price so you can decide whether the stock looks attractive or expensive. All of this is available within an easy tool on the Community page that updates whenever new news or earnings arrive. One investor might build a Narrative that leans on the higher US$258 analyst target and a view that AI supports margins and long term earnings, while another might anchor around the US$197 lower target with greater weight on P&C pricing pressure and tech disruption risk. Both perspectives can coexist and adjust in real time as fresh information comes in.
Do you think there's more to the story for Marsh & McLennan Companies? Head over to our Community to see what others are saying!

This article by Simply Wall St is general in nature. We provide commentary based on historical data and analyst forecasts only using an unbiased methodology and our articles are not intended to be financial advice. It does not constitute a recommendation to buy or sell any stock, and does not take account of your objectives, or your financial situation. We aim to bring you long-term focused analysis driven by fundamental data. Note that our analysis may not factor in the latest price-sensitive company announcements or qualitative material. Simply Wall St has no position in any stocks mentioned.
Have feedback on this article? Concerned about the content? Get in touch with us directly. Alternatively, email editorial-team@simplywallst.com