
- If you are trying to work out whether American Tower is attractively priced or not, the recent share performance gives you a useful starting point but not the full story.
- The stock last closed at US$185.07, with returns of a 0.6% decline over 7 days, a 3.7% decline over 30 days, a 5.9% gain year to date, and a 10.8% decline over 1 year.
- Recent headlines have focused on American Tower as a key player in listed real estate focused on telecom infrastructure, alongside ongoing attention on interest rate expectations that tend to influence sentiment toward REITs. Together, these themes help explain why the share price has seen mixed returns across different timeframes.
- On Simply Wall St's valuation checks, American Tower currently scores 4 out of 6. This sets up a closer look at how different valuation methods assess the stock and hints at a more detailed way to think about value at the end of this article.
Find out why American Tower's -10.8% return over the last year is lagging behind its peers.
Approach 1: American Tower Discounted Cash Flow (DCF) Analysis
The DCF model here projects American Tower’s adjusted funds from operations into the future and then discounts those cash flows back to today to estimate what the business might be worth per share in the present.
American Tower’s latest twelve month free cash flow is about $5.0b. Based on analyst inputs and further extrapolations, projected free cash flow rises to $6.6b by 2030, with a detailed path mapped out year by year from 2026 to 2035. Simply Wall St uses a 2 Stage Free Cash Flow to Equity model, starting with analyst forecasts and then extending the series using its own growth assumptions.
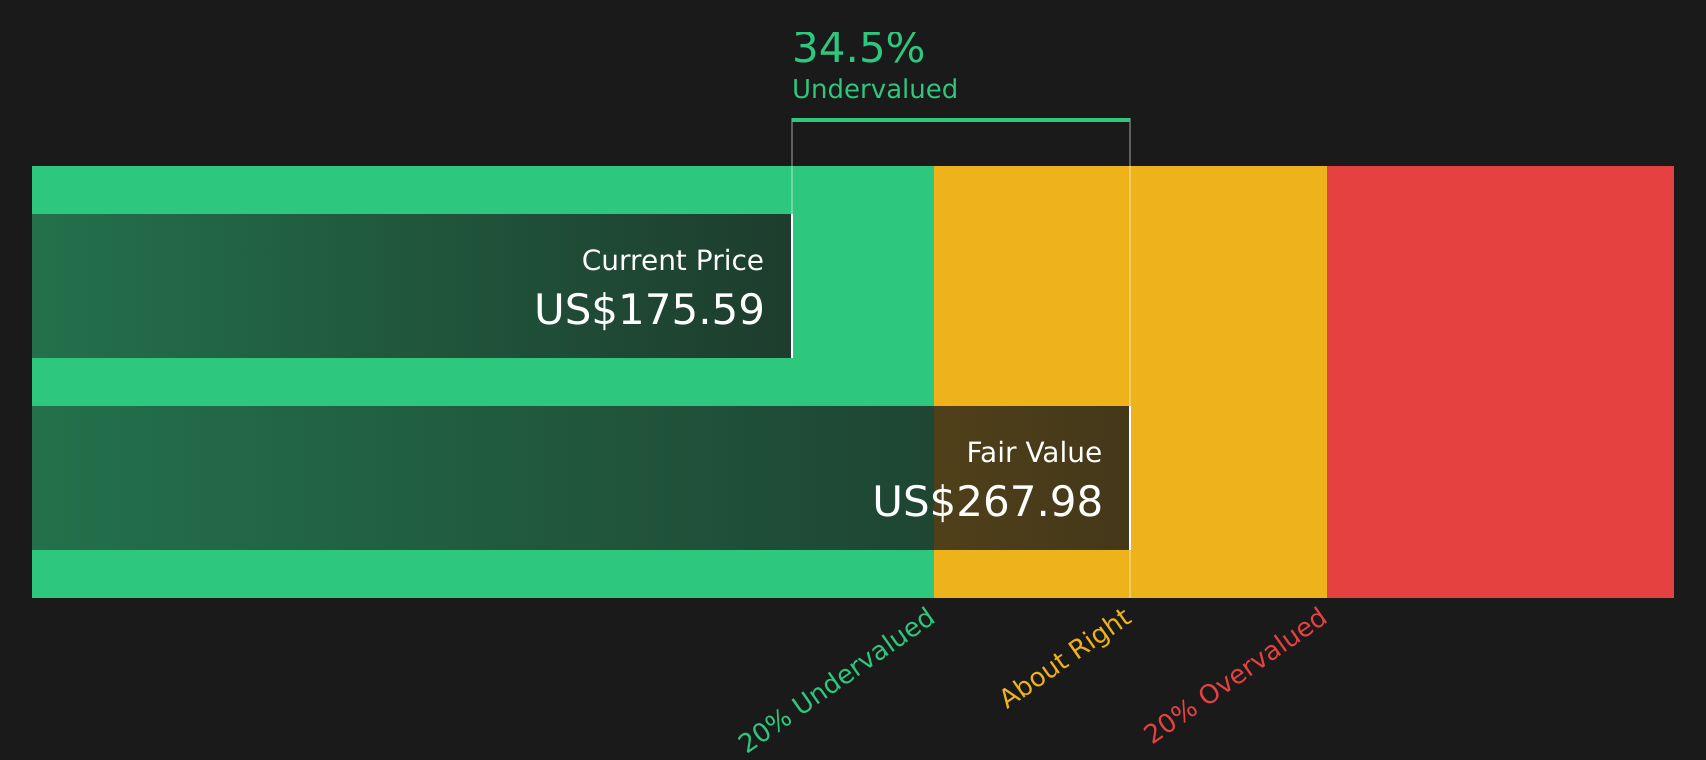
Aggregating and discounting those projected cash flows results in an estimated intrinsic value of about $268.65 per share. Compared with the recent share price of $185.07, the model suggests the stock trades at a 31.1% discount to this DCF estimate, which points to American Tower being undervalued on this specific cash flow view.
Result: UNDERVALUED
Our Discounted Cash Flow (DCF) analysis suggests American Tower is undervalued by 31.1%. Track this in your watchlist or portfolio, or discover 49 more high quality undervalued stocks.
Approach 2: American Tower Price vs Earnings
For profitable companies like American Tower, the P/E ratio is a straightforward way to relate what you pay for each share to the earnings that back it. Investors typically accept a higher P/E if they expect stronger growth or see the business as lower risk, and a lower P/E if growth expectations or perceived risk are more muted.
American Tower currently trades at about 34.1x earnings. This sits above the Specialized REITs industry average P/E of 15.9x, but below the peer group average of 43.4x. Simply Wall St’s proprietary “Fair Ratio” for American Tower is 35.1x, which reflects factors such as its earnings growth profile, profit margins, industry, market cap and risk characteristics.
The Fair Ratio is designed to be more tailored than a simple comparison with peers or industry averages, because those benchmarks may mix companies with very different growth rates, risk levels and profitability. Comparing American Tower’s current P/E of 34.1x with its Fair Ratio of 35.1x suggests the valuation is slightly below this customised benchmark, which points to the shares being modestly undervalued on this metric.
Result: UNDERVALUED

P/E ratios tell one story, but what if the real opportunity lies elsewhere? Start investing in legacies, not executives. Discover our 20 top founder-led companies.
Upgrade Your Decision Making: Choose your American Tower Narrative
Earlier it was mentioned that there is an even better way to understand valuation, so Narratives are introduced here as a simple way for you to link the story you believe about a company to a financial forecast and then to a fair value that you can compare with the current share price.
A Narrative on Simply Wall St lets you set your own expectations for future revenue, earnings and profit margins, then see what fair value those assumptions suggest for American Tower, all in one place on the Community page that is used by millions of investors.
Because Narratives are updated whenever new data arrives, such as fresh earnings or major news, they help you quickly see whether your fair value still makes sense and whether the gap between fair value and the current price points to an opportunity or a reason to be cautious.
For American Tower, one investor might build a Narrative that leads to a significantly higher fair value, while another might use more conservative revenue and margin assumptions that result in a much lower fair value. Seeing these side by side can help you judge which view feels more reasonable for your own decision making.
Do you think there's more to the story for American Tower? Head over to our Community to see what others are saying!

This article by Simply Wall St is general in nature. We provide commentary based on historical data and analyst forecasts only using an unbiased methodology and our articles are not intended to be financial advice. It does not constitute a recommendation to buy or sell any stock, and does not take account of your objectives, or your financial situation. We aim to bring you long-term focused analysis driven by fundamental data. Note that our analysis may not factor in the latest price-sensitive company announcements or qualitative material. Simply Wall St has no position in any stocks mentioned.
Have feedback on this article? Concerned about the content? Get in touch with us directly. Alternatively, email editorial-team@simplywallst.com