
- If you are wondering whether Nelnet is still reasonably priced after its recent run, this article walks through what the current share price could mean for long term investors.
- Nelnet shares last closed at US$135.39, with returns of 5.2% over the past week, 5.0% year to date, 14.8% over 1 year, 52.5% over 3 years, and 88.7% over 5 years, which naturally raises questions about what is already reflected in the price.
- Recent news around Nelnet has focused on its position within diversified financials and how it allocates capital across its business lines, giving investors extra context for these return figures. These updates have kept attention on whether the current share price fairly reflects the risks and opportunities in its underlying operations.
- On our checks, Nelnet has a valuation score of 0 out of 6, which we will break down using several common valuation approaches, before finishing with a way of looking at value that can help tie all these methods together.
Nelnet scores just 0/6 on our valuation checks. See what other red flags we found in the full valuation breakdown.
Approach 1: Nelnet Excess Returns Analysis
The Excess Returns model looks at how much profit a company can generate above the return that equity investors typically require. It starts with what shareholders have invested, compares that to the earnings the business can sustainably generate, and then values the stream of any excess profit over time.
For Nelnet, the model uses a Book Value of $102.74 per share and a Stable EPS of $4.90 per share, based on the median return on equity from the past 5 years. The Average Return on Equity is 5.40%, while the Cost of Equity is $10.24 per share. That gap produces an Excess Return estimate of $5.35 per share in the wrong direction, which signals earnings that do not fully cover the model’s required return on equity capital.
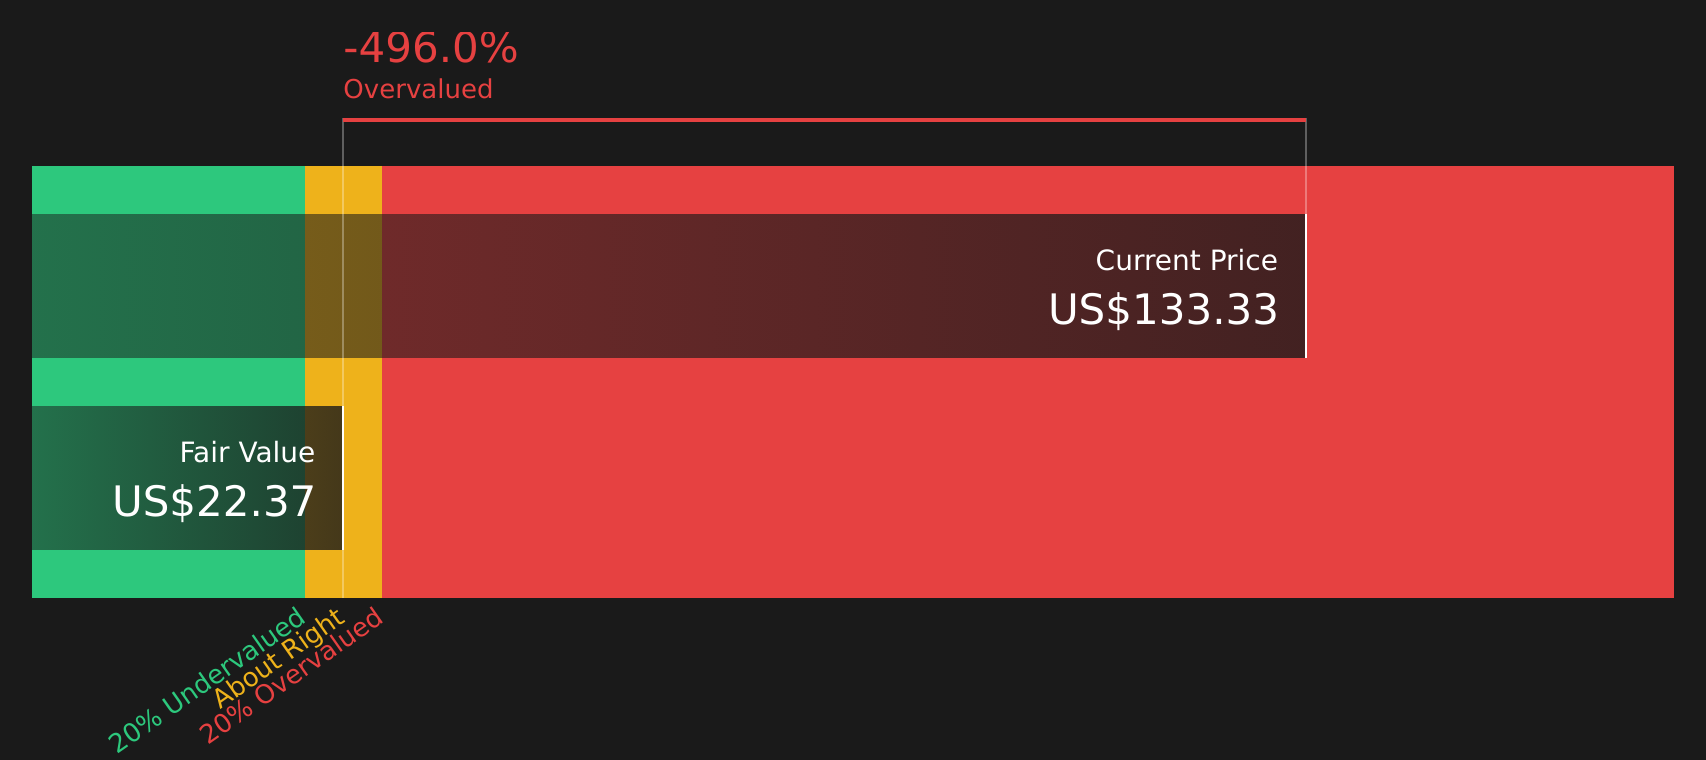
The Stable Book Value used in the model is $90.68 per share, again anchored to the median book value from the past 5 years. Putting these inputs together, the Excess Returns model arrives at an intrinsic value estimate of about $22.87 per share, which is very low relative to the recent share price of US$135.39 and implies the stock is very expensive using this lens.
Result: OVERVALUED
Our Excess Returns analysis suggests Nelnet may be overvalued by 491.9%. Discover 49 high quality undervalued stocks or create your own screener to find better value opportunities.
Approach 2: Nelnet Price vs Earnings
For a profitable company like Nelnet, the P/E ratio is a useful yardstick because it links what you pay directly to the earnings the business is currently generating per share. It gives you a quick sense of how many dollars investors are willing to pay today for each dollar of earnings.
What counts as a “normal” or “fair” P/E often reflects what investors expect for future growth and how much risk they see in those earnings. Higher expected growth and lower perceived risk can justify a higher P/E, while lower growth expectations or higher risk usually point to a lower multiple.
Nelnet currently trades on a P/E of 11.34x, compared with the Consumer Finance industry average of 8.65x and a peer group average of 9.28x. Simply Wall St’s “Fair Ratio” is a proprietary estimate of the P/E you might expect given factors such as earnings growth, industry, profit margins, market cap and company specific risks. This tends to be more tailored than a simple comparison with peers or industry averages, which treat all companies in the group as if they had the same outlook and risk profile.
Because a specific Fair Ratio figure is not available here, you cannot directly classify the shares as overvalued or undervalued using this method alone.
Result: ABOUT RIGHT

P/E ratios tell one story, but what if the real opportunity lies elsewhere? Start investing in legacies, not executives. Discover our 18 top founder-led companies.
Upgrade Your Decision Making: Choose your Nelnet Narrative
Earlier we mentioned that there is an even better way to understand valuation, so let us introduce you to Narratives, which are simply your own story about Nelnet tied directly to the numbers you think are reasonable for its future revenue, earnings, margins and fair value. On Simply Wall St’s Community page, you can set up a Narrative that links what you believe about Nelnet’s business to a financial forecast, then to a Fair Value estimate that you can compare with the current share price to help decide whether it looks like a buy, a hold, or a candidate to sell. Narratives on the platform are easy to adjust and are automatically refreshed when new information such as earnings reports or news is added, so your view of value is always working off the latest data rather than a static model. For example, one Nelnet Narrative might assume very conservative earnings and arrive at a Fair Value well below today’s price, while another more optimistic Narrative could support a Fair Value closer to or above US$135.39.
Do you think there's more to the story for Nelnet? Head over to our Community to see what others are saying!

This article by Simply Wall St is general in nature. We provide commentary based on historical data and analyst forecasts only using an unbiased methodology and our articles are not intended to be financial advice. It does not constitute a recommendation to buy or sell any stock, and does not take account of your objectives, or your financial situation. We aim to bring you long-term focused analysis driven by fundamental data. Note that our analysis may not factor in the latest price-sensitive company announcements or qualitative material. Simply Wall St has no position in any stocks mentioned.
Have feedback on this article? Concerned about the content? Get in touch with us directly. Alternatively, email editorial-team@simplywallst.com