
What Nelnet’s Recent Performance Tells You
Nelnet (NNI) has drawn fresh attention after a steady run, with the share price around $131.32 and total return figures ranging from the past month to the past 5 years catching investor interest.
See our latest analysis for Nelnet.
Over the past year, Nelnet’s share price has generally trended higher to around $131.32, with a 1-year total shareholder return of 18.44% pointing to momentum that has been building rather than fading.
If Nelnet’s steady gains have you thinking about where else capital could work hard, it might be worth scanning our list of 20 top founder-led companies as a next step.
With revenue of about US$1.70b, net income near US$433.86m and the share price sitting close to a US$140 analyst target, investors may ask whether Nelnet is still undervalued or if the market is already pricing in future growth.
Price-to-Earnings of 10.9x: Is it justified?
Nelnet is trading on a P/E of 10.9x, with the last close at $131.32, which screens as cheaper than the broader US market but richer than its direct Consumer Finance peers.
The P/E ratio compares the current share price to the company’s earnings per share, so it tells you how much investors are paying for each dollar of profit. For a diversified financial group like Nelnet, which has loan servicing, education technology, payments and asset management operations, P/E is a quick way to see how its earnings are being valued against other listed companies.
Here, the 10.9x P/E sits below the US market average of 19.4x, so the shares are priced at a discount to the wider market. At the same time, the ratio is higher than the US Consumer Finance industry average of 8.4x, so within its own industry group investors are paying a premium. Against the SWS fair P/E estimate of 12.2x, the current multiple is lower, which indicates that there may be scope for the market to move closer to that fair level if sentiment or earnings remain stable.
Explore the SWS fair ratio for Nelnet
Result: Price-to-Earnings of 10.9x (ABOUT RIGHT)
However, there are some watchpoints, including an annual net income decline of 4% and questions around whether education and loan related revenue growth of 1.6% can support the current multiple.
Find out about the key risks to this Nelnet narrative.
Another View: Our DCF Model Paints A Different Picture
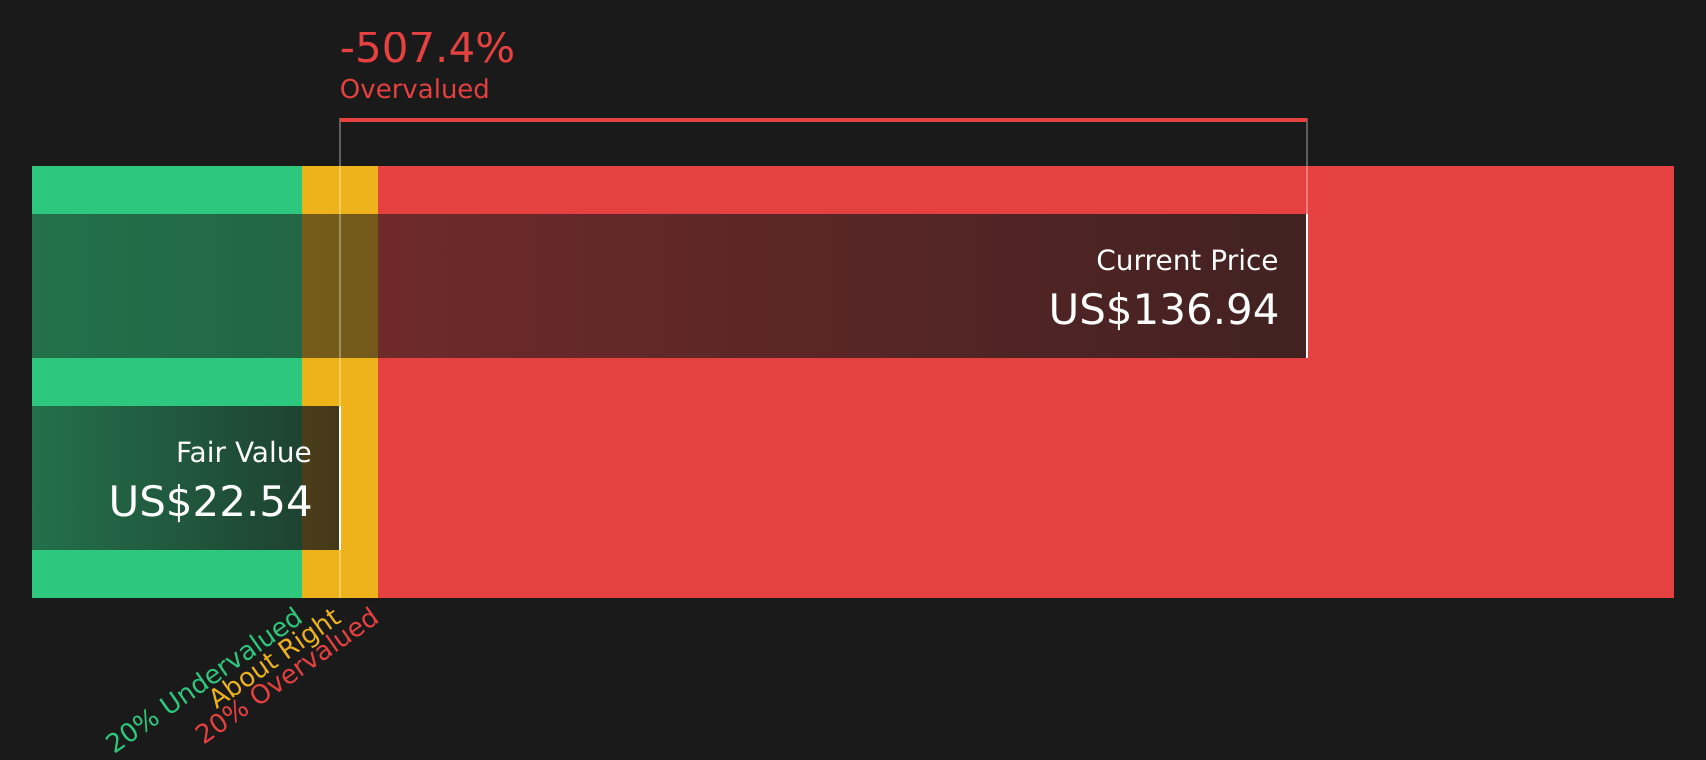
While the P/E of 10.9x hints at reasonable value, our DCF model points the other way. On that measure, NNI at $131.32 sits well above an estimated future cash flow value of $22.88, which raises the question of how much optimism is already in the price.
Look into how the SWS DCF model arrives at its fair value.
Simply Wall St performs a discounted cash flow (DCF) on every stock in the world every day (check out Nelnet for example). We show the entire calculation in full. You can track the result in your watchlist or portfolio and be alerted when this changes, or use our stock screener to discover 54 high quality undervalued stocks. If you save a screener we even alert you when new companies match - so you never miss a potential opportunity.
Next Steps
If this mixed picture has you on the fence, take a moment to look through the numbers yourself and decide what they really signal. Then weigh the balance of 2 key rewards and 2 important warning signs against your own checklist.
Ready To Hunt For Your Next Idea?
If Nelnet has sharpened your focus, do not stop here. Put more names on your radar now so you are not looking back wishing you had.
- Target quality at a discount by running your own shortlist through our 54 high quality undervalued stocks and see which companies line up with your expectations.
- Prioritise resilience and sleep easier by narrowing your watchlist to companies in the 79 resilient stocks with low risk scores that score well on fundamental risk checks.
- Get ahead of the crowd by scanning the screener containing 24 high quality undiscovered gems and spotting underfollowed names before they are widely talked about.
This article by Simply Wall St is general in nature. We provide commentary based on historical data and analyst forecasts only using an unbiased methodology and our articles are not intended to be financial advice. It does not constitute a recommendation to buy or sell any stock, and does not take account of your objectives, or your financial situation. We aim to bring you long-term focused analysis driven by fundamental data. Note that our analysis may not factor in the latest price-sensitive company announcements or qualitative material. Simply Wall St has no position in any stocks mentioned.
Have feedback on this article? Concerned about the content? Get in touch with us directly. Alternatively, email editorial-team@simplywallst.com