
UGI stock reacts to Q1 earnings and business reshaping
UGI (UGI) is in focus after Q1 FY 2026 earnings, a major business reshaping in Europe, senior leadership changes, and expansion into new U.S. states drew fresh attention to the stock.
See our latest analysis for UGI.
At a share price of US$37.45, UGI has seen a 1 day share price return of 2.19% decline and a softer 7 day and 30 day share price return. However, its 1 year total shareholder return of 17.38% and 5 year total shareholder return of 22.03% show longer term holders have fared better as the recent Q1 results and business reshaping, including European exits and U.S. expansion, reset expectations and perceived risk.
If UGI’s reshaping has you thinking about where capital could move next, it may be worth scanning 24 power grid technology and infrastructure stocks as a way to spot other grid focused opportunities.
With UGI trading at US$37.45 and sitting about 19% below the average analyst price target of US$44.50, the real question is whether this reshaped utility is on sale or if the market already prices in future growth.
Most Popular Narrative: 15.8% Undervalued
With UGI last closing at $37.45 against a narrative fair value of $44.50, the current setup turns on how durable its earnings mix really is.
Divestitures and regulatory wins fuel earnings quality, financial flexibility, and fund investments in grid modernization and renewable energy projects.
Operational efficiencies and growing distributed energy solutions drive margin expansion, customer growth, and improved free cash flow.
Want to see what is sitting behind that confidence in margins and cash flow? The narrative leans heavily on utility rate changes, cleaner gas projects, and a tighter share count story. It is worth examining how those moving parts combine into the $44.50 fair value and a moderate discount rate assumption.
Result: Fair Value of $44.50 (UNDERVALUED)
Have a read of the narrative in full and understand what's behind the forecasts.
However, there is still the risk that long term pressure on European LPG demand, tighter regulation, and higher infrastructure costs could unsettle that margin story.
Find out about the key risks to this UGI narrative.
Another View: Cash Flows Paint A Tougher Picture
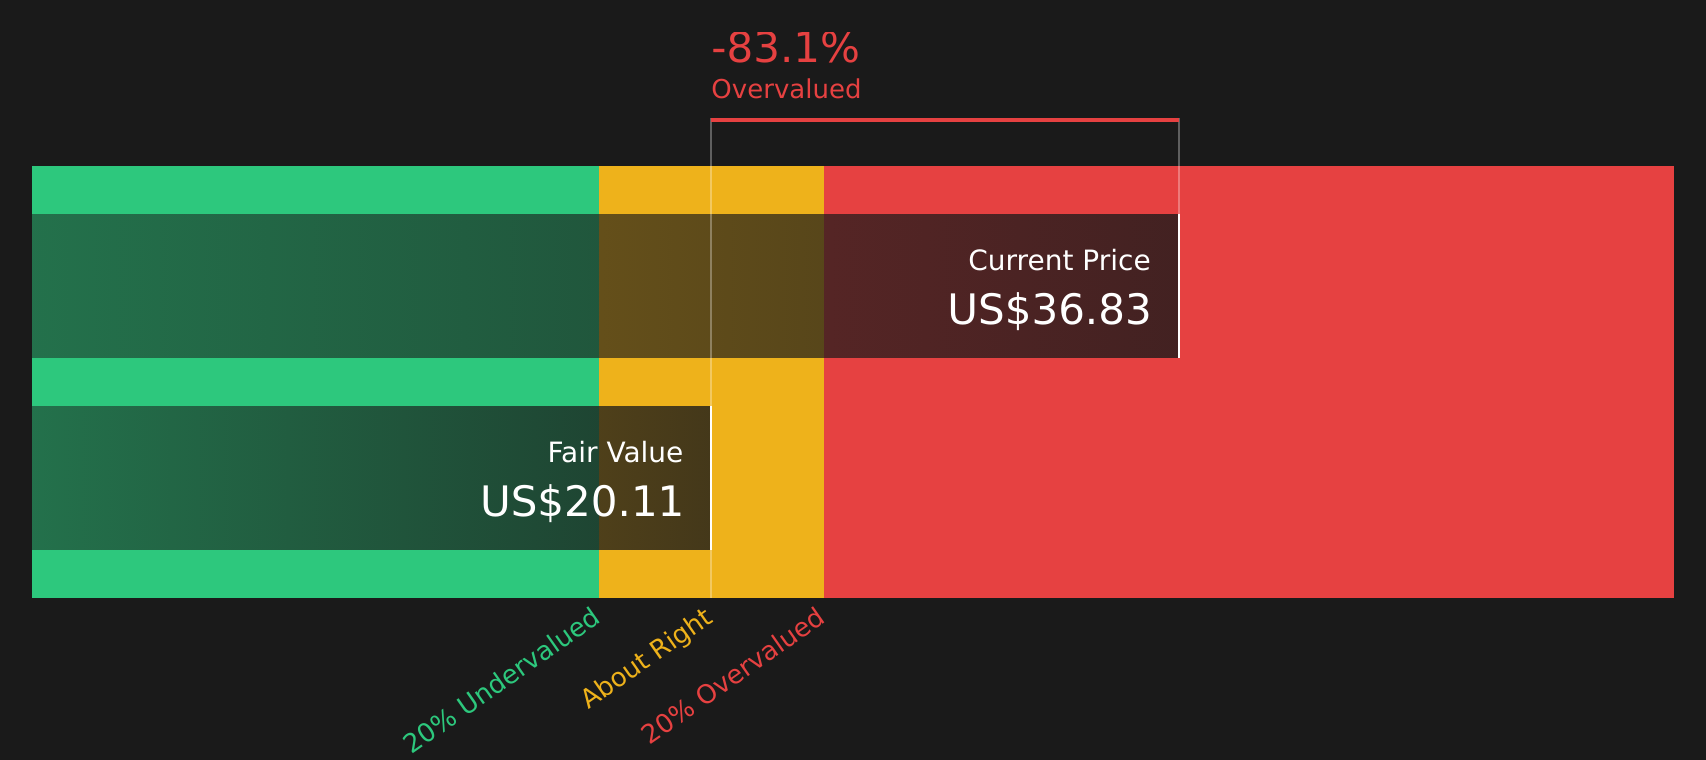
While the narrative fair value sits at $44.50, our DCF model points in the opposite direction, with an estimated future cash flow value of $17.46. On that view, UGI at $37.45 screens as overvalued. This raises the question: which story do you trust more, earnings or cash flows?
Look into how the SWS DCF model arrives at its fair value.
Simply Wall St performs a discounted cash flow (DCF) on every stock in the world every day (check out UGI for example). We show the entire calculation in full. You can track the result in your watchlist or portfolio and be alerted when this changes, or use our stock screener to discover 56 high quality undervalued stocks. If you save a screener we even alert you when new companies match - so you never miss a potential opportunity.
Next Steps
Mixed messages on value and risk here, right? Given there are both flagged risks and clear rewards, it makes sense to act soon and weigh the full picture for yourself with 3 key rewards and 2 important warning signs.
Looking for more investment ideas?
If UGI has sharpened your focus on value, do not just stop here. Broaden your watchlist now or you might miss some meaningful opportunities.
- Target quality first and check out companies flagged in our solid balance sheet and fundamentals stocks screener (42 results) for robust finances that can help underpin more resilient business models.
- Hunt for value by scanning our 56 high quality undervalued stocks to spot companies where price and fundamentals appear meaningfully out of sync.
- Strengthen your income stream by reviewing our 15 dividend fortresses for companies offering higher yields that may appeal to dividend focused portfolios.
This article by Simply Wall St is general in nature. We provide commentary based on historical data and analyst forecasts only using an unbiased methodology and our articles are not intended to be financial advice. It does not constitute a recommendation to buy or sell any stock, and does not take account of your objectives, or your financial situation. We aim to bring you long-term focused analysis driven by fundamental data. Note that our analysis may not factor in the latest price-sensitive company announcements or qualitative material. Simply Wall St has no position in any stocks mentioned.
Have feedback on this article? Concerned about the content? Get in touch with us directly. Alternatively, email editorial-team@simplywallst.com