
PJT Partners (PJT) has been drawing attention after a mixed run in its share price, with a small 1 day gain contrasting with weaker moves over the past month and past 3 months. Investors are reassessing what current pricing implies.
See our latest analysis for PJT Partners.
That small 1 day share price gain sits against a weaker patch, including a 30 day share price return of 13.89% and a year to date share price return of 9.02%. However, the 3 year total shareholder return of 94.41% and 5 year total shareholder return of 136.84% show how much longer term holders have experienced a very different journey.
If this kind of move in an advisory firm has you thinking about where else value might be hiding, broaden your search with our 23 top founder-led companies.
With revenue growth running at 8.58% and shares sitting around $154.24, plus a discount of about 12% to the average analyst price target, you have to ask: is PJT underappreciated or already pricing in future growth?
Preferred P/E of 20.8x: Is it justified?
On earnings, PJT is priced at a P/E of 20.8x, which sits between cheaper peers and a slightly higher broader Capital Markets industry.
P/E tells you how many dollars investors are currently willing to pay for each dollar of PJT's earnings, which matters a lot for an advisory focused firm where fee income can swing with deal activity. A 20.8x P/E suggests the market is putting a reasonably full tag on current profits rather than treating PJT as a bargain idea.
Compared with its immediate peer group, PJT screens as expensive, with its 20.8x P/E above the 16.6x peer average. Yet against the wider US Capital Markets industry average of 22.1x, the same 20.8x P/E looks slightly leaner, which signals investors are not pricing it at the top end of the sector. See what the numbers say about this price — find out in our valuation breakdown.
Result: Price-to-earnings of 20.8x (ABOUT RIGHT)
However, you still have to weigh the risk that advisory fee pools remain soft, and that current earnings already reflect a strong period for restructuring work.
Find out about the key risks to this PJT Partners narrative.
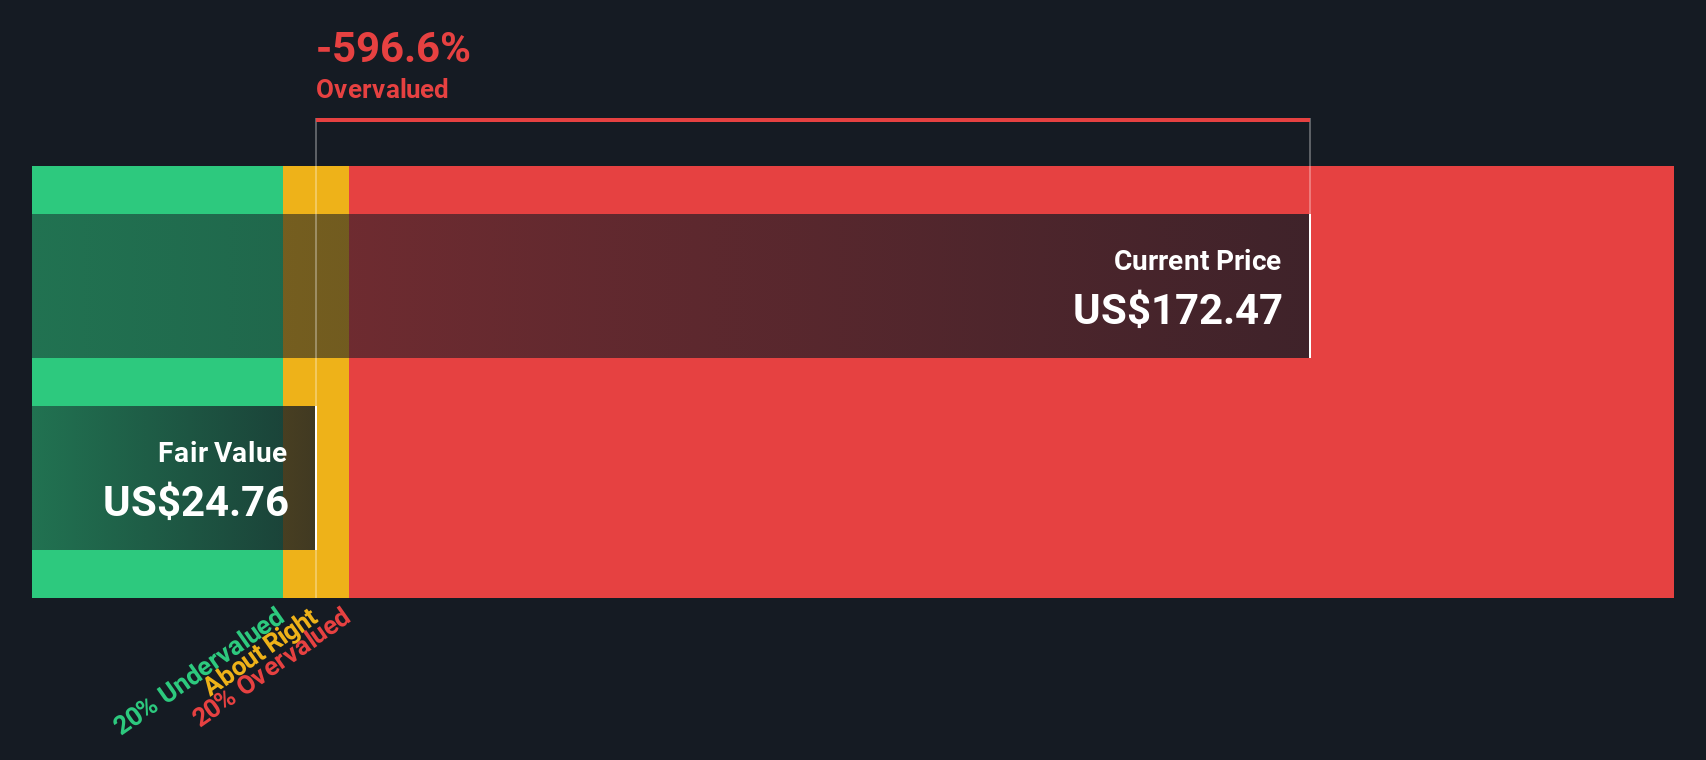
Another View: DCF Sends A Very Different Signal
While the P/E of 20.8x makes PJT look roughly in line with the broader Capital Markets group, our DCF model points in the opposite direction. Through that lens, the shares at $154.24 sit well above an estimated value of $28.68, which implies a lot less room for error if sentiment turns.
Look into how the SWS DCF model arrives at its fair value.
Simply Wall St performs a discounted cash flow (DCF) on every stock in the world every day (check out PJT Partners for example). We show the entire calculation in full. You can track the result in your watchlist or portfolio and be alerted when this changes, or use our stock screener to discover 53 high quality undervalued stocks. If you save a screener we even alert you when new companies match - so you never miss a potential opportunity.
Build Your Own PJT Partners Narrative
If this view does not quite match your take, or you simply prefer to test the numbers yourself, you can build a tailored story around PJT in just a few minutes, starting with Do it your way.
A good starting point is our analysis highlighting 2 key rewards investors are optimistic about regarding PJT Partners.
Looking for more investment ideas?
If PJT has sharpened your thinking, do not stop there. A few targeted screens can quickly surface other opportunities you might be glad you did not overlook.
- Target reliable cash generators by checking companies on our solid balance sheet and fundamentals stocks screener (44 results), where financial strength is front and center.
- Hunt for mispriced quality by scanning the screener containing 23 high quality undiscovered gems that most investors are not watching yet.
- Prioritize sleep at night potential and see which companies stand out in our 85 resilient stocks with low risk scores.
This article by Simply Wall St is general in nature. We provide commentary based on historical data and analyst forecasts only using an unbiased methodology and our articles are not intended to be financial advice. It does not constitute a recommendation to buy or sell any stock, and does not take account of your objectives, or your financial situation. We aim to bring you long-term focused analysis driven by fundamental data. Note that our analysis may not factor in the latest price-sensitive company announcements or qualitative material. Simply Wall St has no position in any stocks mentioned.
Have feedback on this article? Concerned about the content? Get in touch with us directly. Alternatively, email editorial-team@simplywallst.com