
Alexander's (ALX) is back in focus after its latest earnings release, where fourth quarter results came in below analyst expectations and both revenue and net income declined compared with the prior year period.
See our latest analysis for Alexander's.
The recent earnings miss and weaker profitability seem to have weighed on sentiment, with a 7 day share price return of negative 8.31%. However, the 90 day share price return of 8.01% and 1 year total shareholder return of 24.14% suggest longer term momentum has been more positive.
If this mixed picture has you looking beyond a single REIT, it could be a good moment to broaden your search with our 23 top founder-led companies as potential long term compounders.
With earnings under pressure, a value score of 1 and the share price trading above the average analyst target, the key question is whether Alexander's is misunderstood by the market or whether future growth is already fully priced in.
Preferred P/E of 42.3x: Is it justified?
On a P/E basis, Alexander's looks expensive, with its 42.3x multiple sitting well above the US Retail REITs peer average and paired with earnings under pressure.
The P/E ratio compares the share price to earnings per share and is a quick way of seeing how much investors are paying for each dollar of current profit. For a REIT like Alexander's, a higher P/E can sometimes reflect expectations for steadier income or asset quality. In this case, it sits alongside forecasts for earnings to decline by an average of 9.2% per year over the next 3 years.
Against that backdrop, Alexander's 42.3x P/E is not only higher than the US Retail REITs industry average of 27.8x, it is also above the estimated fair P/E of 29.1x that our fair ratio work suggests the market could eventually lean toward.
Explore the SWS fair ratio for Alexander's
Result: Price-to-Earnings of 42.3x (OVERVALUED)
However, you also need to weigh continued net income pressure from the forecast 9.2% annual decline and the current share price premium to the US$190 analyst target as potential downside catalysts.
Find out about the key risks to this Alexander's narrative.
Another view from our DCF model
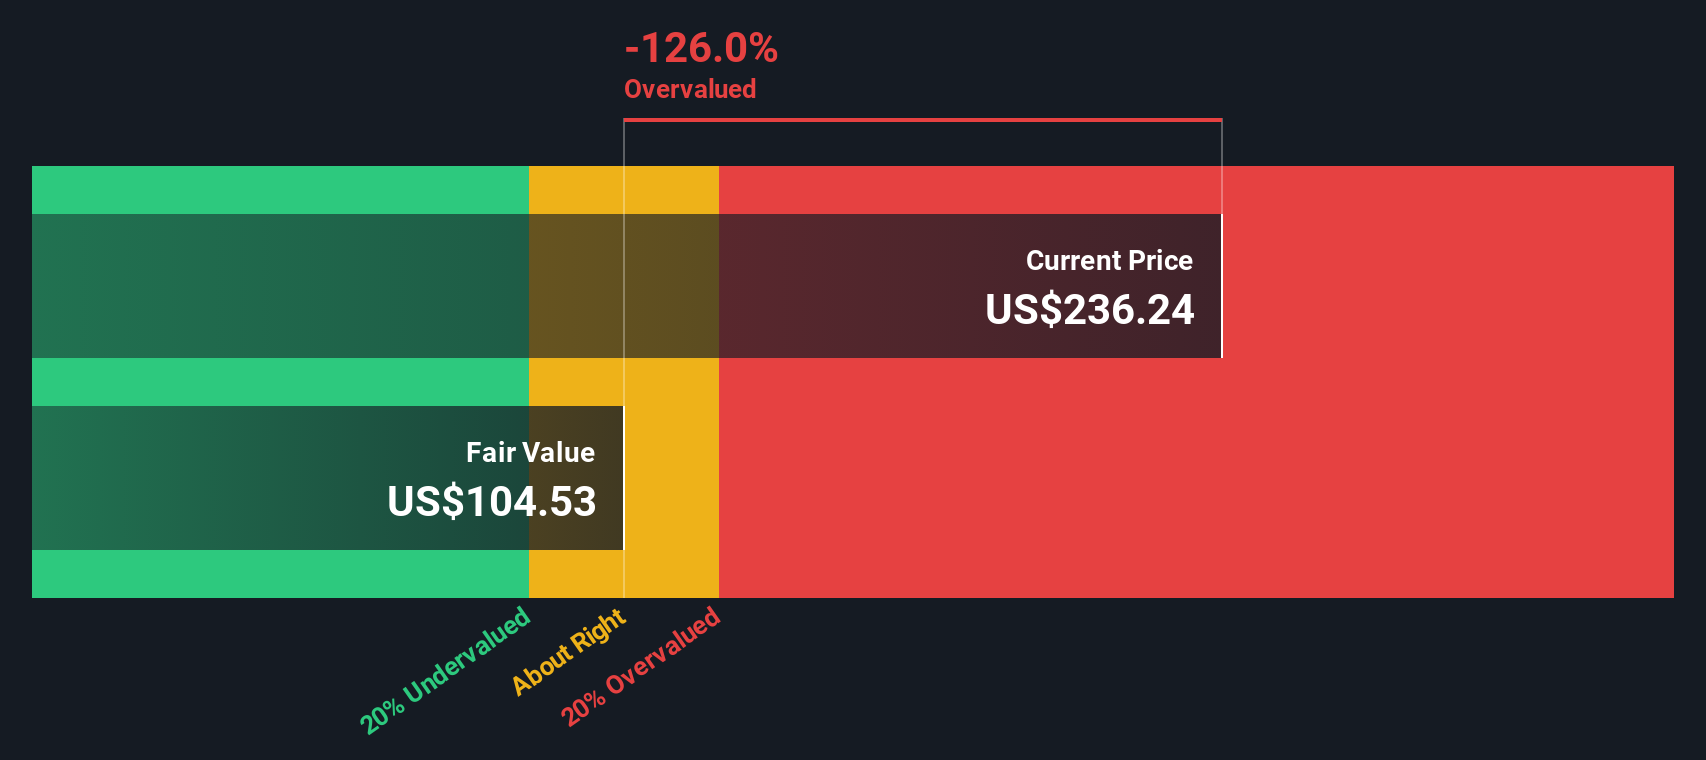
While the P/E points to a rich price, our DCF model approaches the question from a different angle by focusing on future cash flows. On that basis, Alexander's recent price of $233.87 is above our estimate of future cash flow value at $171, which also indicates overvaluation. For you, the real issue is how comfortable you are paying that kind of premium for this REIT's cash flow profile.
Look into how the SWS DCF model arrives at its fair value.
Simply Wall St performs a discounted cash flow (DCF) on every stock in the world every day (check out Alexander's for example). We show the entire calculation in full. You can track the result in your watchlist or portfolio and be alerted when this changes, or use our stock screener to discover 56 high quality undervalued stocks. If you save a screener we even alert you when new companies match - so you never miss a potential opportunity.
Build Your Own Alexander's Narrative
If you look at these numbers and reach a different conclusion, or simply prefer to test your own view against the data, you can create a tailored thesis for Alexander's in just a few minutes, so why not Do it your way today.
A great starting point for your Alexander's research is our analysis highlighting 4 important warning signs that could impact your investment decision.
Ready for more investment ideas?
If Alexander's has sharpened your thinking, do not stop here, use the Simply Wall St screener to spot other opportunities that fit your style.
- Pinpoint rock solid balance sheets and steadier fundamentals with our solid balance sheet and fundamentals stocks screener (44 results) so you are not left holding fragile names when conditions get tougher.
- Hunt for quality on sale by scanning our 56 high quality undervalued stocks and make sure you see potential bargains before they move out of reach.
- Lock in income focused ideas through the 13 dividend fortresses and get a clearer view of companies that might support regular cash returns.
This article by Simply Wall St is general in nature. We provide commentary based on historical data and analyst forecasts only using an unbiased methodology and our articles are not intended to be financial advice. It does not constitute a recommendation to buy or sell any stock, and does not take account of your objectives, or your financial situation. We aim to bring you long-term focused analysis driven by fundamental data. Note that our analysis may not factor in the latest price-sensitive company announcements or qualitative material. Simply Wall St has no position in any stocks mentioned.
Have feedback on this article? Concerned about the content? Get in touch with us directly. Alternatively, email editorial-team@simplywallst.com