
- If you are wondering whether Kirby's current share price fairly reflects what you are getting as an investor, you are not alone. The stock invites a closer look at what you are actually paying for.
- Kirby recently closed at US$121.38, with returns of 2.2% over the past week, a 2.0% decline over the last month, 8.5% year to date, 12.8% over 1 year, 64.6% over 3 years and 107.0% over 5 years.
- These moves sit against a backdrop of ongoing interest in marine transportation, where investors often weigh Kirby's position in barge transportation and related services against broader sector sentiment. Recent coverage has focused on how companies like Kirby are positioned within US infrastructure and energy logistics, giving extra context to the stock's price path.
- On our checks, Kirby currently scores 0 out of 6 on valuation. This raises the question of how different methods such as multiples and cash flow models treat the stock, and whether there is an even richer way to think about value that we will come back to at the end.
Kirby scores just 0/6 on our valuation checks. See what other red flags we found in the full valuation breakdown.
Approach 1: Kirby Discounted Cash Flow (DCF) Analysis
A Discounted Cash Flow, or DCF, model takes the cash Kirby is expected to generate in the future and discounts those amounts back to a single value today using a required rate of return. It is essentially answering the question: what are all those future cash flows worth in present terms?
For Kirby, the model used is a 2 Stage Free Cash Flow to Equity approach based on cash flow projections. The latest twelve-month Free Cash Flow is about $223.3 million, with Simply Wall St using analyst estimates to project $337.2 million in Free Cash Flow for 2024, followed by further annual projections out to 2035. Beyond the explicit analyst horizon, those later years are extrapolated by Simply Wall St using modest growth assumptions rather than direct forecasts.
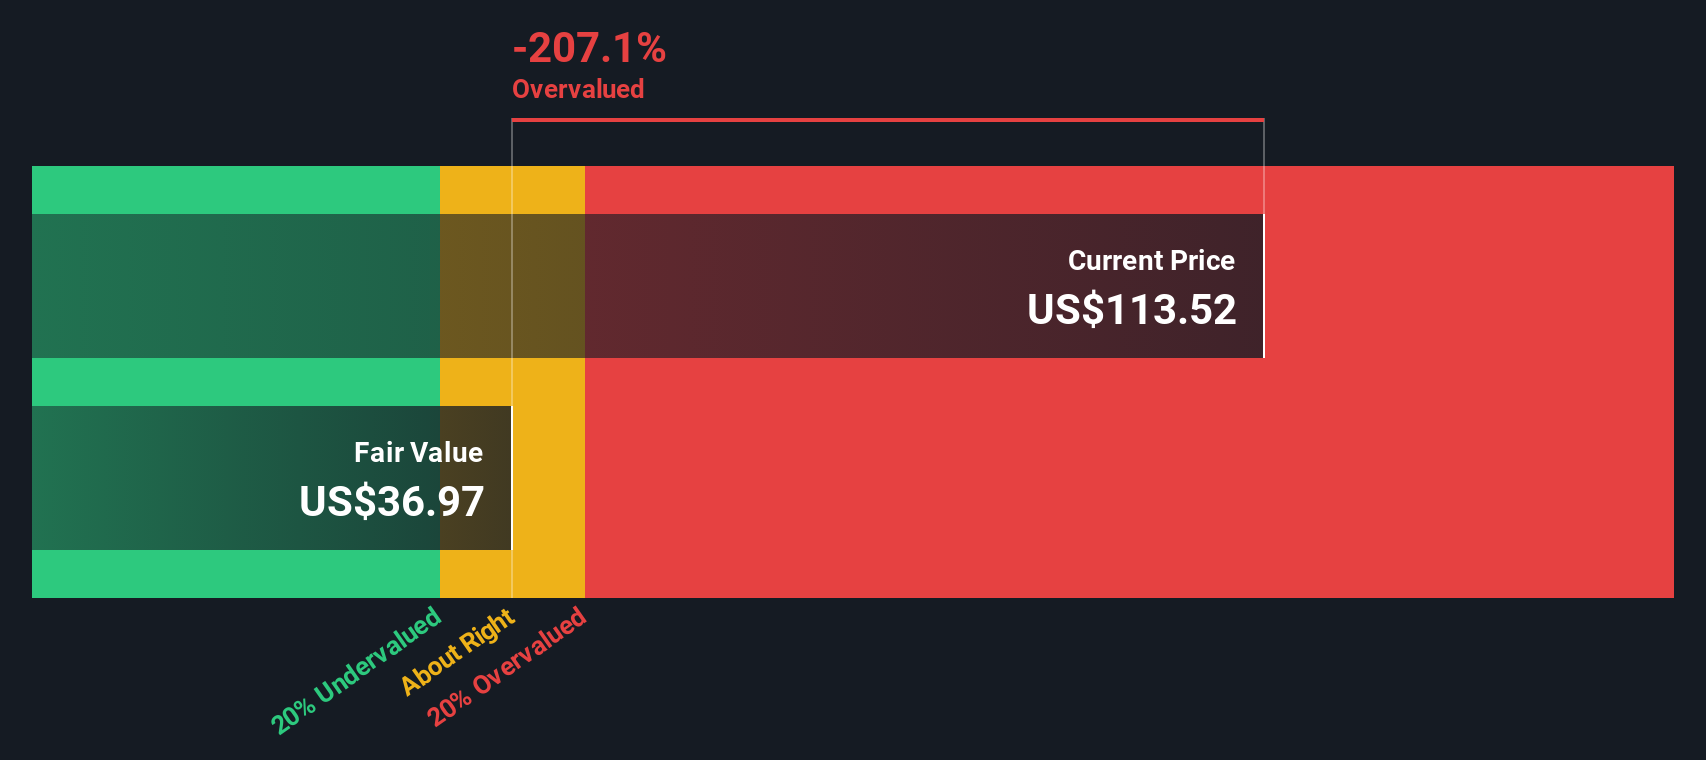
Adding up and discounting these projected cash flows gives an estimated intrinsic value of about $98.20 per share, compared with the recent share price of $121.38. On this basis, the DCF output suggests Kirby trades at roughly a 23.6% premium to that intrinsic estimate, so the stock currently screens as expensive on this model.
Result: OVERVALUED
Our Discounted Cash Flow (DCF) analysis suggests Kirby may be overvalued by 23.6%. Discover 55 high quality undervalued stocks or create your own screener to find better value opportunities.
Approach 2: Kirby Price vs Earnings
For a profitable company like Kirby, the P/E ratio is a straightforward way to connect what you pay per share with the earnings that back that share. Investors usually accept a higher P/E when they expect stronger earnings growth or see the business as lower risk, and a lower P/E when growth expectations or perceived risks pull that valuation down.
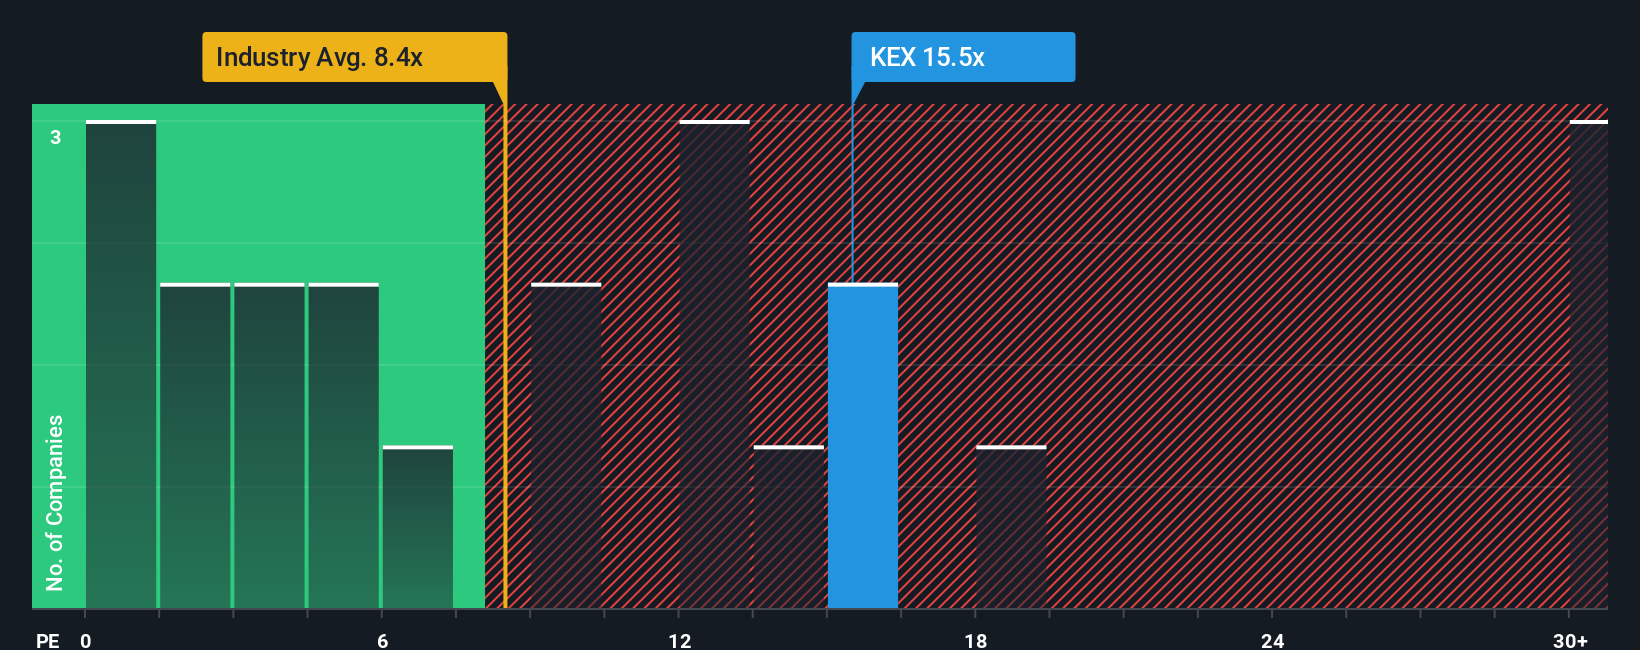
Kirby currently trades on a P/E of 18.55x. That sits above the Shipping industry average P/E of 10.42x and also above the peer group average of 16.28x. This suggests the market is putting a higher earnings multiple on Kirby than on many of its closest comparables.
Simply Wall St’s Fair Ratio for Kirby is 16.07x. This is a proprietary estimate of what a reasonable P/E might be given factors such as the company’s earnings growth profile, industry, profit margins, market cap and specific risks. Because it blends these elements instead of relying only on broad peer or industry comparisons, the Fair Ratio can offer a more tailored reference point for a stock like Kirby.
Comparing the Fair Ratio of 16.07x with the current P/E of 18.55x indicates that Kirby is trading above that implied fair range.
Result: OVERVALUED
P/E ratios tell one story, but what if the real opportunity lies elsewhere? Start investing in legacies, not executives. Discover our 23 top founder-led companies.
Upgrade Your Decision Making: Choose your Kirby Narrative
Earlier we mentioned that there is an even better way to think about valuation. Let us introduce you to Narratives, which are simply your own story for Kirby that links what you believe about its business to a set of revenue, earnings and margin forecasts, and then to a fair value that you can compare with the current share price.
On Simply Wall St, within the Community page used by millions of investors, you can set up a Kirby Narrative by plugging in assumptions that match how you see its barge exposure, data center related demand, manufacturing reshoring or risks in petrochemicals and costs. You can then see the fair value that results and how that compares with today’s price.
Narratives update automatically when new information such as Kirby’s news, earnings or fair value inputs are refreshed, so your story, forecast and fair value stay current without you needing to rebuild the whole model each time.
For example, some investors currently anchor on an assumed fair value around US$98 per share, while others use the higher Community fair value of about US$139.67. This shows how two different Kirby Narratives can lead to very different views on whether the current US$121.38 price looks attractive or stretched.
Do you think there's more to the story for Kirby? Head over to our Community to see what others are saying!

This article by Simply Wall St is general in nature. We provide commentary based on historical data and analyst forecasts only using an unbiased methodology and our articles are not intended to be financial advice. It does not constitute a recommendation to buy or sell any stock, and does not take account of your objectives, or your financial situation. We aim to bring you long-term focused analysis driven by fundamental data. Note that our analysis may not factor in the latest price-sensitive company announcements or qualitative material. Simply Wall St has no position in any stocks mentioned.
Have feedback on this article? Concerned about the content? Get in touch with us directly. Alternatively, email editorial-team@simplywallst.com