
Alexander's (ALX) closed out FY 2025 with Q4 total revenue of US$53.3 million and basic EPS of US$0.74, alongside funds from operations of US$12.5 million. This puts the latest quarter in clear focus for income driven REIT investors. The company has seen quarterly revenue move from US$55.9 million and EPS of US$2.39 in Q4 2024 to US$53.3 million and EPS of US$0.74 in Q4 2025. Trailing twelve month net profit margin sat at 17% compared with 20.3% a year earlier as earnings slipped over a five year period at an average 11.1% a year. This sets up a results season where investors are likely to weigh rich income against pressure on margins.
See our full analysis for Alexander's.With the latest figures on the table, the next step is to see how these results line up with the widely held narratives around Alexander's, and where the numbers start to push back on those stories.
Curious how numbers become stories that shape markets? Explore Community Narratives
FFO and net income cool over the year
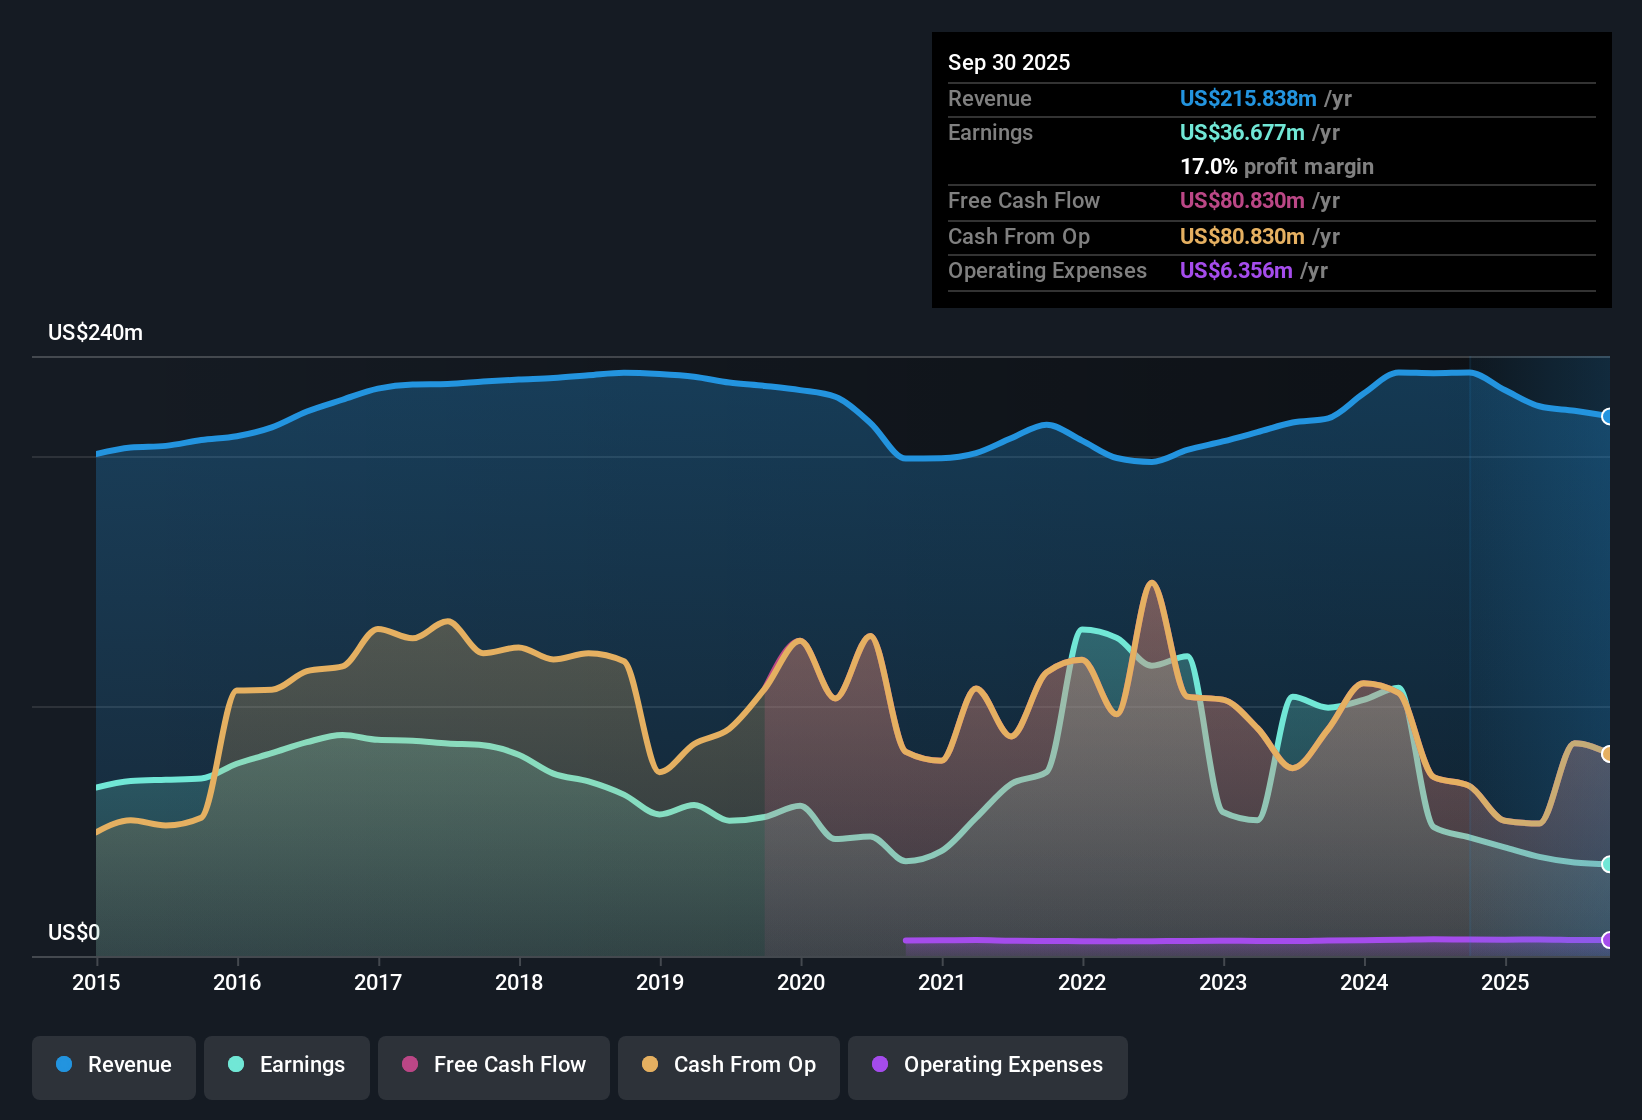
- On a trailing twelve month basis, FFO moved from US$77.97 million in Q4 2024 to US$63.00 million in Q4 2025, while net income excluding extra items went from US$43.44 million to US$28.22 million over the same periods.
- What stands out for a bearish view is that this multi year earnings decline of 11.1% a year and the drop in net profit margin from 20.3% to 17% sit alongside a 7.94% dividend yield. Critics highlight this combination as a sign that current income may be leaning on past strength rather than current profitability.
- Those bears also point to interest payments not being well covered by earnings, so the lower trailing FFO and net income figures feed directly into concerns about how easily the REIT can service debt and keep paying a high dividend.
- For an income focused investor, that combination of weaker earnings and thinner margin makes it important to check whether cash generation and payout policies still match your risk comfort level.
Margins and coverage under pressure at 17%
- Over the last 12 months, Alexander's reported a 17% net profit margin compared with 20.3% a year earlier, alongside earnings that declined at an average 11.1% a year over the past five years.
- Supporters of a more bullish angle often focus on the underlying real estate and tenant quality. However, the data here places the spotlight on earnings quality instead, with the thinner 17% margin and weaker interest coverage both reminding you that even strong assets can be paired with financial structures that leave less room for shocks.
- Because interest payments are not well covered by earnings in the recent data, margin compression directly affects the cushion available after servicing debt.
- The combination of multi year earnings decline and a relatively high dividend payout shows why many investors treat reported coverage ratios as a key part of the thesis, not just a footnote.
P/E of 31.6x versus DCF fair value
- Alexander's trades on a P/E of 31.6x, above the US Retail REITs industry average of 27x, below the peer average of 49.9x, and above a DCF fair value of about US$169.96 compared with a current share price of US$233.77.
- For investors weighing a more balanced narrative, valuation signals pull in different directions. The higher P/E than the industry and the gap between share price and DCF fair value line up with the five year 11.1% annual earnings decline and 17% margin, yet the discount to the peer group P/E suggests some investors still see relative appeal even with those weaker profitability trends.
- The DCF fair value sitting below the current share price is one reason some holders may question how much of the REIT's income profile is already reflected in the valuation.
- At the same time, trading below the peer average P/E of 49.9x hints that not all REITs with similar profiles are priced the same way, which can be important context if you are comparing ALX with alternatives.
Next Steps
Don't just look at this quarter; the real story is in the long-term trend. We've done an in-depth analysis on Alexander's's growth and its valuation to see if today's price is a bargain. Add the company to your watchlist or portfolio now so you don't miss the next big move.
See What Else Is Out There
With multi year earnings declining at 11.1% a year, a thinner 17% net margin and concern over interest coverage, Alexander's financial cushion looks tighter.
If those pressure points make you want steadier footing, run your eye over our solid balance sheet and fundamentals stocks screener (45 results) today so you can focus on companies with stronger coverage and resilience.
This article by Simply Wall St is general in nature. We provide commentary based on historical data and analyst forecasts only using an unbiased methodology and our articles are not intended to be financial advice. It does not constitute a recommendation to buy or sell any stock, and does not take account of your objectives, or your financial situation. We aim to bring you long-term focused analysis driven by fundamental data. Note that our analysis may not factor in the latest price-sensitive company announcements or qualitative material. Simply Wall St has no position in any stocks mentioned.
Have feedback on this article? Concerned about the content? Get in touch with us directly. Alternatively, email editorial-team@simplywallst.com