
- If you are trying to figure out whether Molina Healthcare's share price reflects its true worth, the starting point is understanding how its current market price compares with a range of valuation checks.
- The stock last closed at US$176.84, with returns of a 4.4% decline over 7 days, 4.3% decline over 30 days, 0.9% decline year to date, 38.0% decline over 1 year, 41.3% decline over 3 years, and 18.2% decline over 5 years, which may have shifted how investors see its potential and its risks.
- Recent news coverage has focused on Molina Healthcare as part of broader conversations about managed care companies, regulation and healthcare program funding. This helps frame how the market thinks about its long-term prospects and provides useful context when you look at a share price that has moved meaningfully over multi-year periods.
- On our valuation checks, Molina Healthcare currently has a valuation score of 5/6, suggesting it screens as undervalued on most of the metrics we run. Next, we look at what different valuation approaches say about the stock, before finishing with a more complete way to think about valuation overall.
Find out why Molina Healthcare's -38.0% return over the last year is lagging behind its peers.
Approach 1: Molina Healthcare Discounted Cash Flow (DCF) Analysis
A Discounted Cash Flow, or DCF, model projects a company’s future cash flows and then discounts them back to today using a required rate of return. The goal is to estimate what those future cash flows are worth in today’s dollars.
For Molina Healthcare, the model used is a 2 Stage Free Cash Flow to Equity approach, based on cash flow projections and extrapolations. The latest twelve month free cash flow is a loss of $573.33m, so the valuation leans heavily on what analysts and the model expect the business to generate going forward rather than on the most recent year alone.
Analyst and model projections in the data set run through to 2035, with free cash flow estimates such as $632.50m in 2026 and $1,637m in 2030, all in $. Simply Wall St extrapolates beyond the initial analyst horizon to complete the 10 year path.
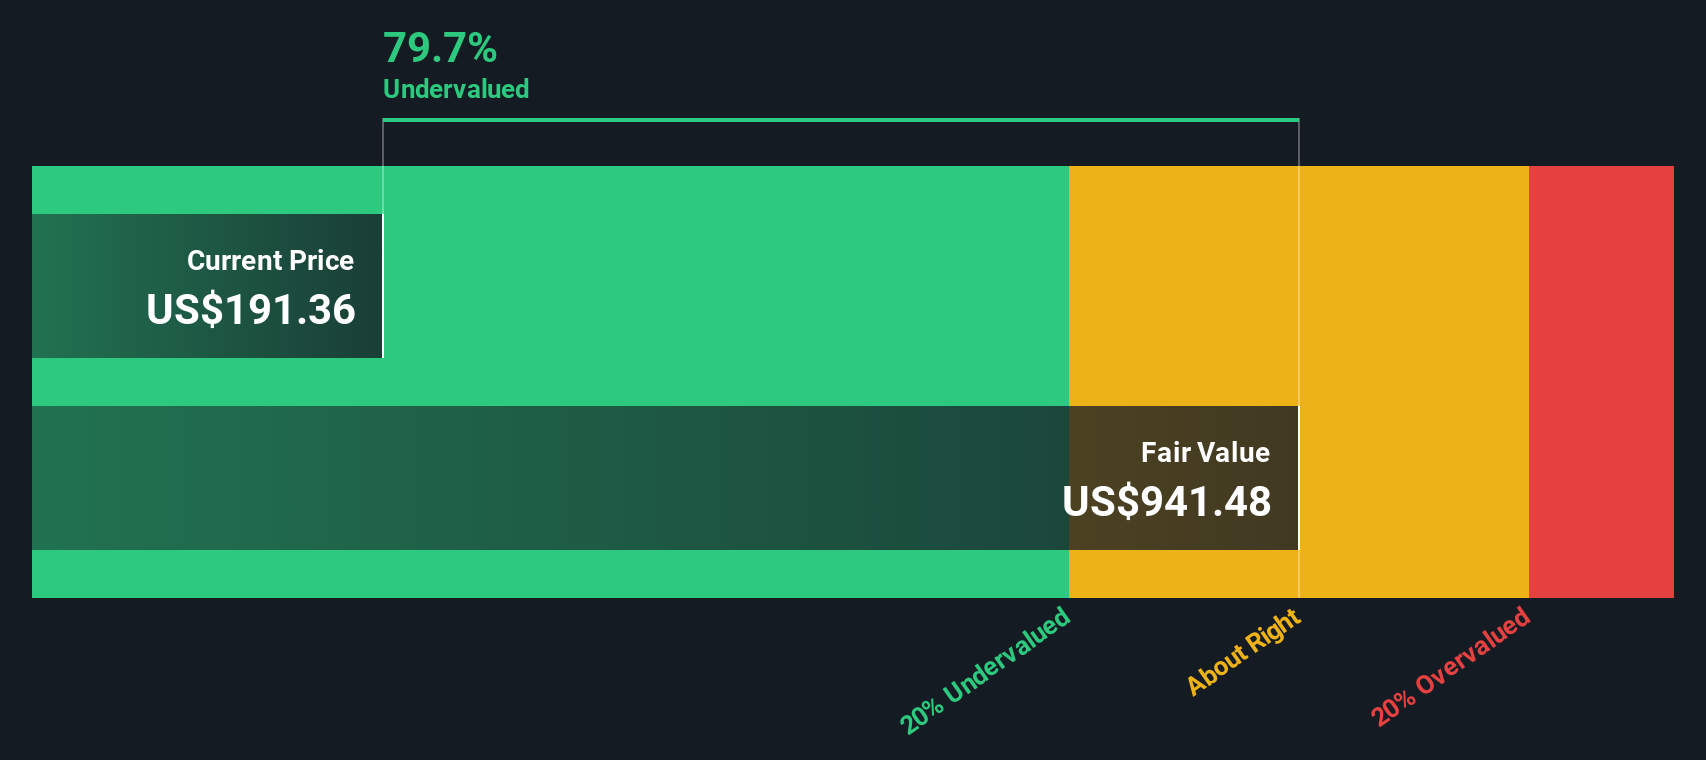
Aggregating and discounting these projected cash flows gives an estimated intrinsic value of US$812.03 per share, which implies the shares trade at a 78.2% discount to this DCF estimate.
Result: UNDERVALUED
Our Discounted Cash Flow (DCF) analysis suggests Molina Healthcare is undervalued by 78.2%. Track this in your watchlist or portfolio, or discover 55 more high quality undervalued stocks.
Approach 2: Molina Healthcare Price vs Earnings
For profitable companies, the P/E ratio is a useful way to link what you pay for each share to the earnings the business is currently generating. It gives you a quick sense of how many dollars investors are paying for each dollar of earnings.
What counts as a “normal” P/E depends a lot on how quickly earnings are expected to grow and how risky those earnings appear. Higher expected growth or lower perceived risk can support a higher P/E, while slower growth or higher risk usually points to a lower one.
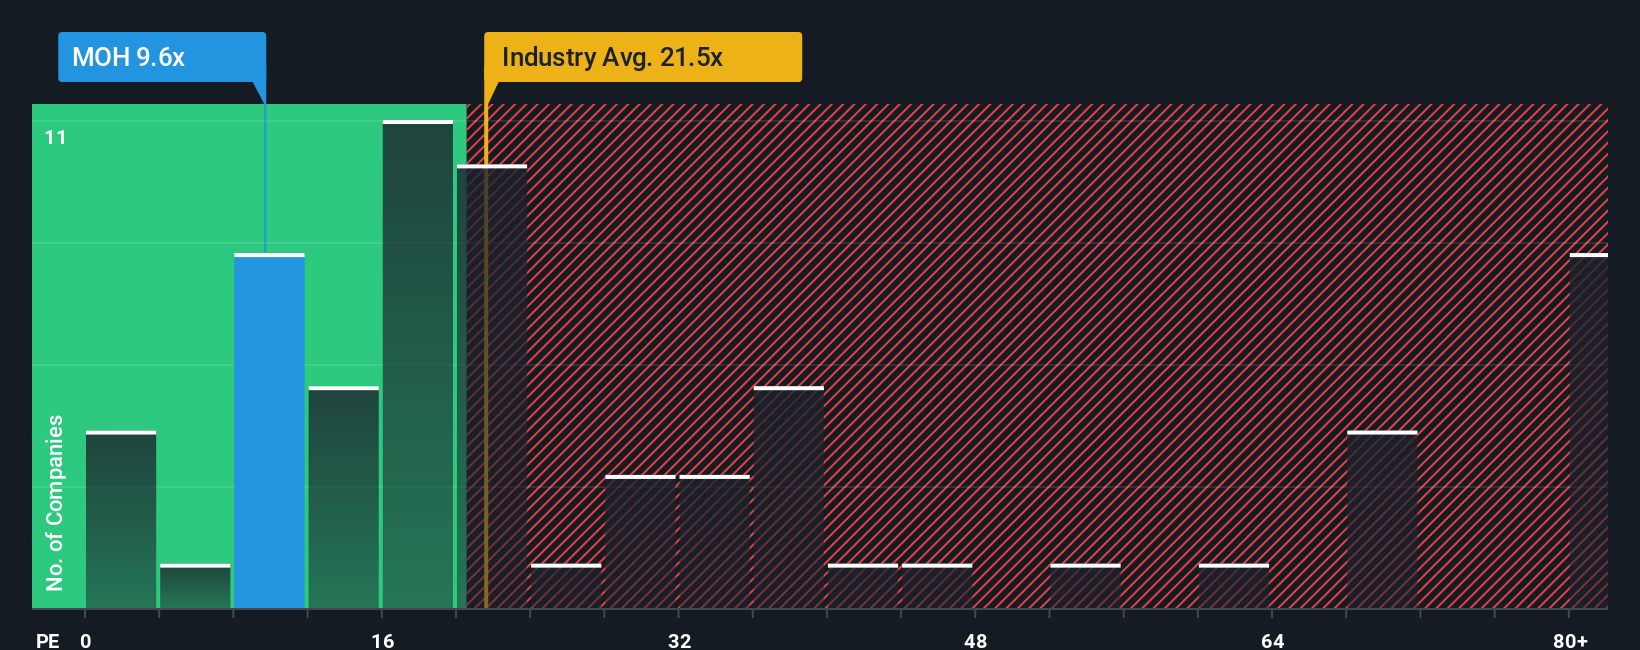
Molina Healthcare currently trades at a P/E of 10.29x. That compares with a Healthcare industry average P/E of 23.18x and a peer group average of 24.94x, so the shares are priced at a lower multiple than both the sector and peers. Simply Wall St’s Fair Ratio for Molina Healthcare is 23.71x, which is its proprietary view of what a reasonable P/E would be given factors such as the company’s earnings growth profile, industry, profit margin, market cap and risk characteristics.
The Fair Ratio goes further than a simple peer or industry comparison because it adjusts for those fundamentals instead of assuming all Healthcare stocks deserve similar multiples. With the current P/E of 10.29x sitting well below the Fair Ratio of 23.71x, the shares screen as undervalued on this metric.
Result: UNDERVALUED
P/E ratios tell one story, but what if the real opportunity lies elsewhere? Start investing in legacies, not executives. Discover our 22 top founder-led companies.
Upgrade Your Decision Making: Choose your Molina Healthcare Narrative
Earlier we mentioned that there is an even better way to understand valuation, so let us introduce you to Narratives, which let you turn your view of a company into a clear story behind the numbers such as your fair value and your expectations for future revenue, earnings and margins.
A Narrative links three things: what you think is happening in the business, how that flows into a financial forecast, and the fair value that drops out of those assumptions. On Simply Wall St you can build and compare these Narratives on the Community page, which is already used by millions of investors.
Once you have a Narrative, you can compare its fair value to the current share price to help you decide whether you see the stock as attractive or expensive. Because Narratives update when new information like news or earnings arrives, your view stays aligned with the latest data instead of going stale.
For Molina Healthcare, one investor might build a Narrative that assumes stronger margins and a higher fair value, while another might focus on regulatory risks and use more cautious revenue and earnings forecasts, which leads to a meaningfully lower fair value from the same starting price.
Do you think there's more to the story for Molina Healthcare? Head over to our Community to see what others are saying!

This article by Simply Wall St is general in nature. We provide commentary based on historical data and analyst forecasts only using an unbiased methodology and our articles are not intended to be financial advice. It does not constitute a recommendation to buy or sell any stock, and does not take account of your objectives, or your financial situation. We aim to bring you long-term focused analysis driven by fundamental data. Note that our analysis may not factor in the latest price-sensitive company announcements or qualitative material. Simply Wall St has no position in any stocks mentioned.
Have feedback on this article? Concerned about the content? Get in touch with us directly. Alternatively, email editorial-team@simplywallst.com