
Brookfield Business (BBUC) just paired its 2025 earnings release with an update on a broad corporate reorganization, capital recycling activity above US$2b, debt reduction, and four acquisitions, including a planned Fosber purchase in packaging machinery.
See our latest analysis for Brookfield Business.
These announcements come after a mixed stretch for the stock, with a 1-day share price return of 1.08% taking the share price to $35.66. The 30 day share price return is 2.03% lower, yet the 1 year total shareholder return of 50.61% and 3 year total shareholder return of 59.38% point to stronger momentum over a longer horizon.
If Brookfield Business's reorganization and acquisitions have caught your eye, it may be worth broadening your search and checking out fast growing stocks with high insider ownership.
With the stock posting strong multi year returns, an intrinsic value estimate implying a discount, and fresh acquisitions plus a reorganization in motion, you have to ask: is there still a buying opportunity here, or is future growth already priced in?
Preferred Price-to-Sales of 0.3x: Is it justified?
Based on the latest data, Brookfield Business is trading on a P/S of 0.3x, compared with both its peer group at 0.5x and the wider Global Industrials average at 0.9x.
The P/S ratio compares the company’s market value to its revenue, so a lower multiple can indicate that each dollar of sales is being valued more conservatively. For a diversified business services and industrials group that is currently unprofitable, investors often look at revenue-based measures like this when earnings do not yet provide a clear guide.
Here, the gap between 0.3x and the 0.5x peer level suggests the market is assigning a lower value to Brookfield Business’s revenue than to similar companies. The difference to the 0.9x Global Industrials average is even wider. With the company reporting revenue of $7,168.0m and a loss of $875.0m, the low P/S could reflect concern about loss-making operations, but it also means sentiment is materially different compared with many industrial names that trade on higher sales multiples.
Compared with both direct peers and the broader industry, Brookfield Business’s 0.3x P/S sits well below the 0.5x peer average and the 0.9x Global Industrials benchmark, a clear discount on a sales basis.
See what the numbers say about this price — find out in our valuation breakdown.
Result: Price-to-Sales of 0.3x (UNDERVALUED)
However, you still have to weigh execution risks around the reorganization and acquisitions, as well as the impact of a recent $875.0m net loss on future flexibility.
Find out about the key risks to this Brookfield Business narrative.
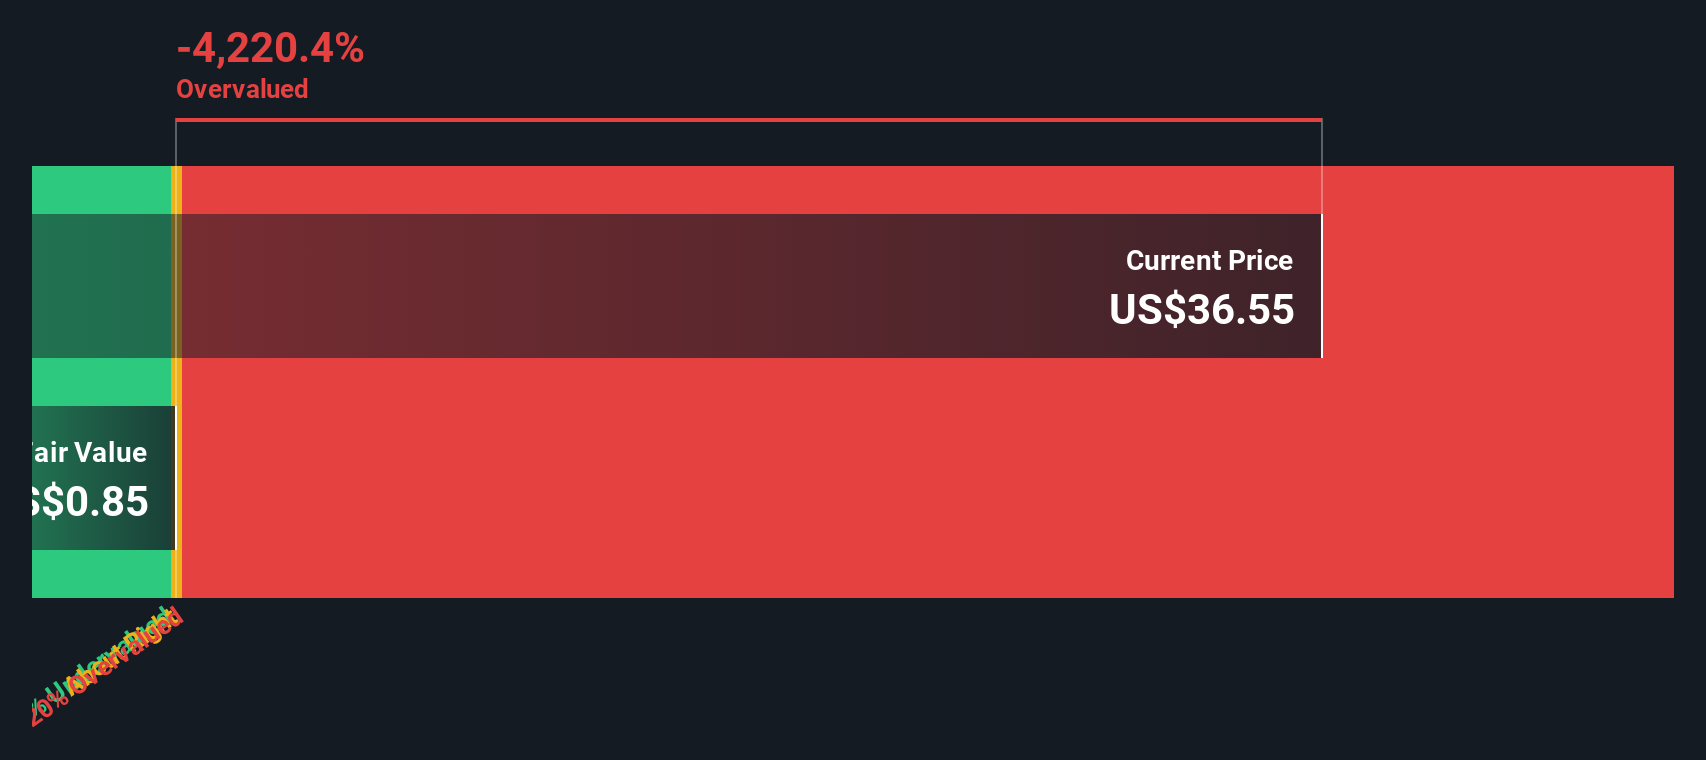
Another View: Our DCF Model Sees Limited Value
While the low 0.3x P/S points to a discount against peers, our DCF model tells a very different story. At a share price of $35.66 versus an estimated future cash flow value of $0.72, the SWS DCF model suggests Brookfield Business is trading well above that estimate. So how should you weigh revenue based value against cash flow driven caution?
Look into how the SWS DCF model arrives at its fair value.
Simply Wall St performs a discounted cash flow (DCF) on every stock in the world every day (check out Brookfield Business for example). We show the entire calculation in full. You can track the result in your watchlist or portfolio and be alerted when this changes, or use our stock screener to discover 875 undervalued stocks based on their cash flows. If you save a screener we even alert you when new companies match - so you never miss a potential opportunity.
Build Your Own Brookfield Business Narrative
If you look at the numbers and reach a different conclusion, or simply prefer to work from your own research, you can build a custom view in just a few minutes with Do it your way.
A great starting point for your Brookfield Business research is our analysis highlighting 1 important warning sign that could impact your investment decision.
Looking for more investment ideas?
If Brookfield Business is on your radar, do not stop here. Your next strong idea could be sitting in plain sight, and you do not want to miss it.
- Spot potential value opportunities early by checking out these 875 undervalued stocks based on cash flows, where the price tags look modest compared to underlying cash flows.
- Ride powerful technology themes by scanning these 24 AI penny stocks, which are tied to real business use cases rather than just headlines.
- Target higher income potential by reviewing these 12 dividend stocks with yields > 3%, which focus on companies sharing more than 3% yields with shareholders.
This article by Simply Wall St is general in nature. We provide commentary based on historical data and analyst forecasts only using an unbiased methodology and our articles are not intended to be financial advice. It does not constitute a recommendation to buy or sell any stock, and does not take account of your objectives, or your financial situation. We aim to bring you long-term focused analysis driven by fundamental data. Note that our analysis may not factor in the latest price-sensitive company announcements or qualitative material. Simply Wall St has no position in any stocks mentioned.
Have feedback on this article? Concerned about the content? Get in touch with us directly. Alternatively, email editorial-team@simplywallst.com