
- If you are wondering whether Constellation Brands’ current share price lines up with its underlying worth, you are not alone. This article is built to help you frame that question clearly.
- The stock last closed at US$156.70, with returns of 13.6% over the past month, 11.0% year to date and a 10.6% decline over the past year. These figures can change how you think about both growth potential and risk.
- Recent coverage has focused on Constellation Brands’ position in the premium beer and spirits market and how investor sentiment has reacted to that focus. This helps explain some of the shorter term share price moves and provides context when you are trying to decide whether the latest returns reflect changing expectations or simply short term swings in sentiment.
- On Simply Wall St’s valuation checks, Constellation Brands scores 2 out of 6 for being assessed as undervalued. Next we will look at how different valuation methods arrive at that view and why there may be an even more helpful way to think about value by the end of this article.
Constellation Brands scores just 2/6 on our valuation checks. See what other red flags we found in the full valuation breakdown.
Approach 1: Constellation Brands Discounted Cash Flow (DCF) Analysis
A Discounted Cash Flow, or DCF, model takes the cash Constellation Brands is expected to generate in the future and discounts those projections back to what they might be worth in today’s dollars.
Simply Wall St uses a 2 Stage Free Cash Flow to Equity model here. Constellation Brands last reported free cash flow of about $1.59b. Based on analyst inputs for the earlier years and extrapolations after that, free cash flow is projected at $2.35b by 2030, with a series of annual projections between 2026 and 2035 that are discounted back to today using the model’s required return assumptions.
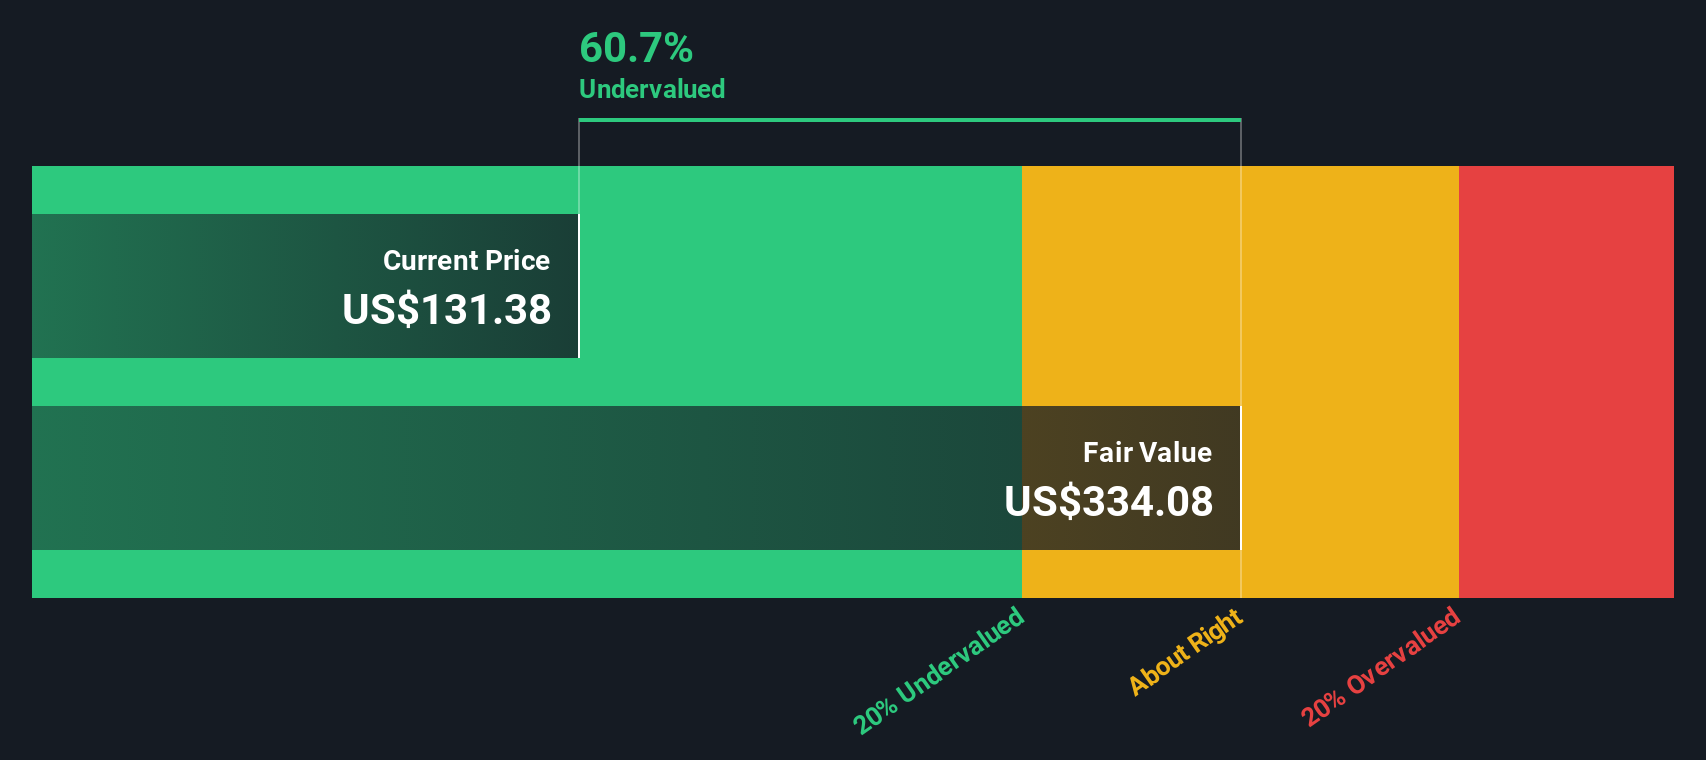
When all of those discounted cash flows are added up, the model arrives at an estimated intrinsic value of US$312.56 per share. Compared with the recent share price of US$156.70, this implies the stock is assessed as 49.9% undervalued using this DCF framework.
Result: UNDERVALUED
Our Discounted Cash Flow (DCF) analysis suggests Constellation Brands is undervalued by 49.9%. Track this in your watchlist or portfolio, or discover 868 more undervalued stocks based on cash flows.
Approach 2: Constellation Brands Price vs Earnings
For a profitable company like Constellation Brands, the P/E ratio is a useful way to link what you pay for the stock to the earnings it currently generates. It helps you see how many dollars investors are willing to pay today for each dollar of earnings.
What counts as a "normal" P/E really depends on how investors view the company’s growth potential and risk. Higher expected growth and lower perceived risk can support a higher P/E, while more uncertainty or lower growth expectations usually point to a lower P/E.
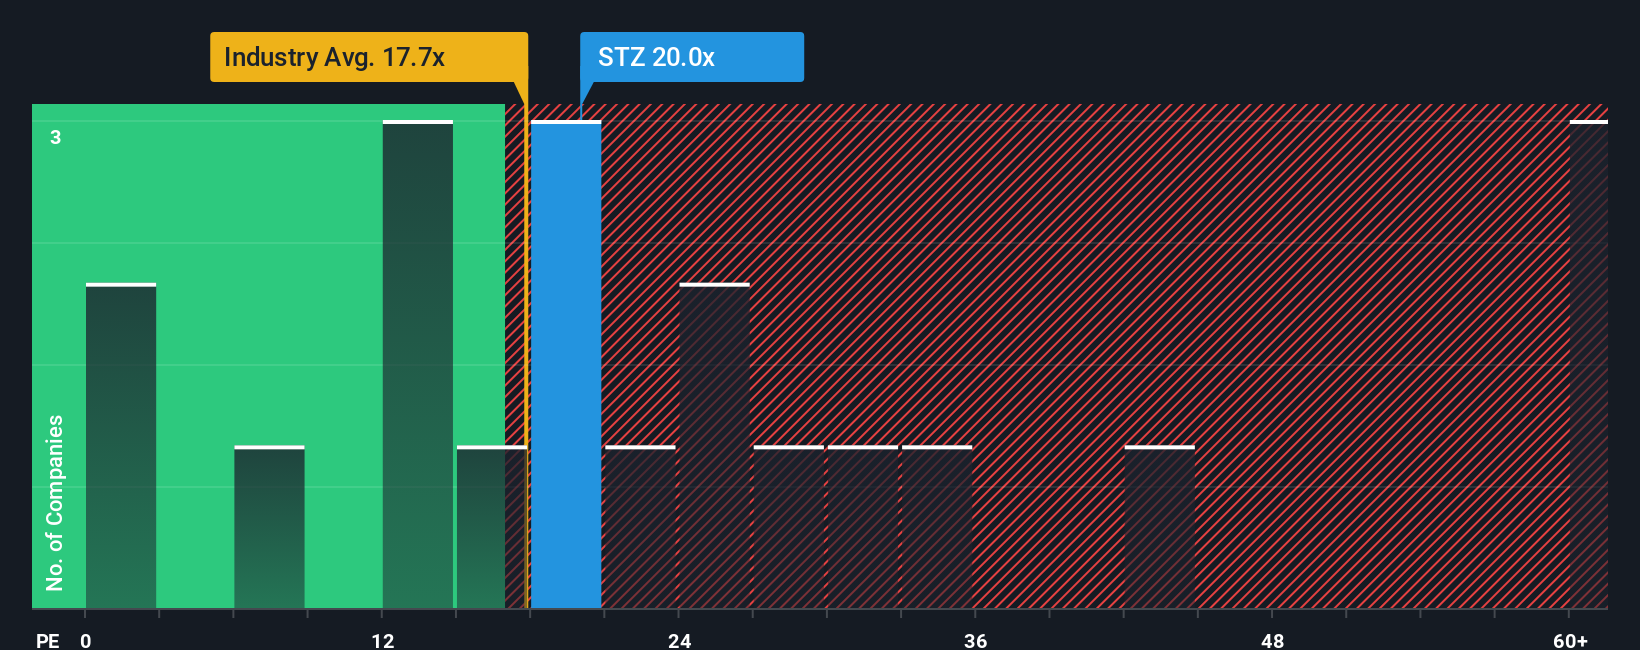
Constellation Brands currently trades on a P/E of 24.49x. That sits above the Beverage industry average of 17.69x and above the peer group average of 19.16x. Simply Wall St’s Fair Ratio for the stock is 21.64x, which is a proprietary estimate of what the P/E might be given factors like earnings growth, industry, profit margins, market cap and company specific risks.
The Fair Ratio can be more informative than a simple comparison with peers because it adjusts for those company specific drivers rather than assuming all Beverage stocks should trade on the same multiple. With the actual P/E of 24.49x sitting above the Fair Ratio of 21.64x, the shares screen as overvalued on this metric.
Result: OVERVALUED
P/E ratios tell one story, but what if the real opportunity lies elsewhere? Discover 1417 companies where insiders are betting big on explosive growth.
Upgrade Your Decision Making: Choose your Constellation Brands Narrative
Earlier we mentioned that there is an even better way to understand valuation, so let us introduce you to Narratives, which are simply your story about Constellation Brands linked directly to your numbers on fair value, expected revenue, earnings and margins.
A Narrative connects three pieces in one place: how you think the business will develop, what that implies for future financials, and the fair value those cash flows could support.
On Simply Wall St, Narratives sit in the Community page and are designed so any investor can quickly set assumptions, see the fair value those assumptions produce, and compare it with the current share price to help decide whether to buy, hold or sell.
Narratives also update when new information like news or earnings is added. If several Constellation Brands Narratives show very different fair values, that reflects investors using the same tool to express different expectations about its premium beer and spirits position and how that could translate into future results.
Do you think there's more to the story for Constellation Brands? Head over to our Community to see what others are saying!

This article by Simply Wall St is general in nature. We provide commentary based on historical data and analyst forecasts only using an unbiased methodology and our articles are not intended to be financial advice. It does not constitute a recommendation to buy or sell any stock, and does not take account of your objectives, or your financial situation. We aim to bring you long-term focused analysis driven by fundamental data. Note that our analysis may not factor in the latest price-sensitive company announcements or qualitative material. Simply Wall St has no position in any stocks mentioned.
Have feedback on this article? Concerned about the content? Get in touch with us directly. Alternatively, email editorial-team@simplywallst.com