
Recent stock performance and business snapshot
Boston Beer Company (SAM) has recently drawn attention after a mixed run in its share price, including a negative move over the past week but gains over the month and past 3 months.
The stock last closed at US$209.74, with year to date and 1 year total returns moving in different directions, and a 3 year and 5 year record that may prompt investors to reassess expectations.
Alongside this share performance, Boston Beer reports annual revenue of US$1.98b and net income of US$91.97m, supported by a portfolio that spans Samuel Adams, Twisted Tea, Truly, Angry Orchard, Dogfish Head and several regional brands.
See our latest analysis for Boston Beer Company.
For Boston Beer, the current share price of US$209.74 comes after a 1 day share price return of 1.69% decline and a 7 day share price return of 5.26% decline, while the 1 year total shareholder return of 17.64% decline and 5 year total shareholder return of 80.61% decline show that recent positive momentum, including a 30 day share price return of 6.17%, is emerging against a much weaker long term record.
If Boston Beer’s mixed performance has you reassessing your watchlist, this could be a good moment to broaden your search with fast growing stocks with high insider ownership.
So with Boston Beer trading at US$209.74, a reported intrinsic discount of 34% and analyst targets around US$240.15, you have to ask: is this a genuine value gap, or is the market already pricing in future growth?
Most Popular Narrative: 12.4% Undervalued
At $209.74, the most followed narrative pegs Boston Beer’s fair value around $239.36, which sets up a clear valuation gap for investors to unpack.
Ongoing productivity initiatives (brewery efficiency, procurement and waste reduction) are structurally raising gross margins, which should continue to benefit earnings as volume normalizes and new, margin-accretive products (e.g., Sun Cruiser) scale.
Want to see what sits behind that margin story? The narrative focuses on profit expansion, disciplined costs, and a future earnings multiple that is expected to compress. Curious how those pieces fit together?
Result: Fair Value of $239.36 (UNDERVALUED)
Have a read of the narrative in full and understand what's behind the forecasts.
However, this hinges on consumers sticking with Beyond Beer products, as well as on competitors not squeezing margins in already crowded RTD and hard seltzer shelves.
Find out about the key risks to this Boston Beer Company narrative.
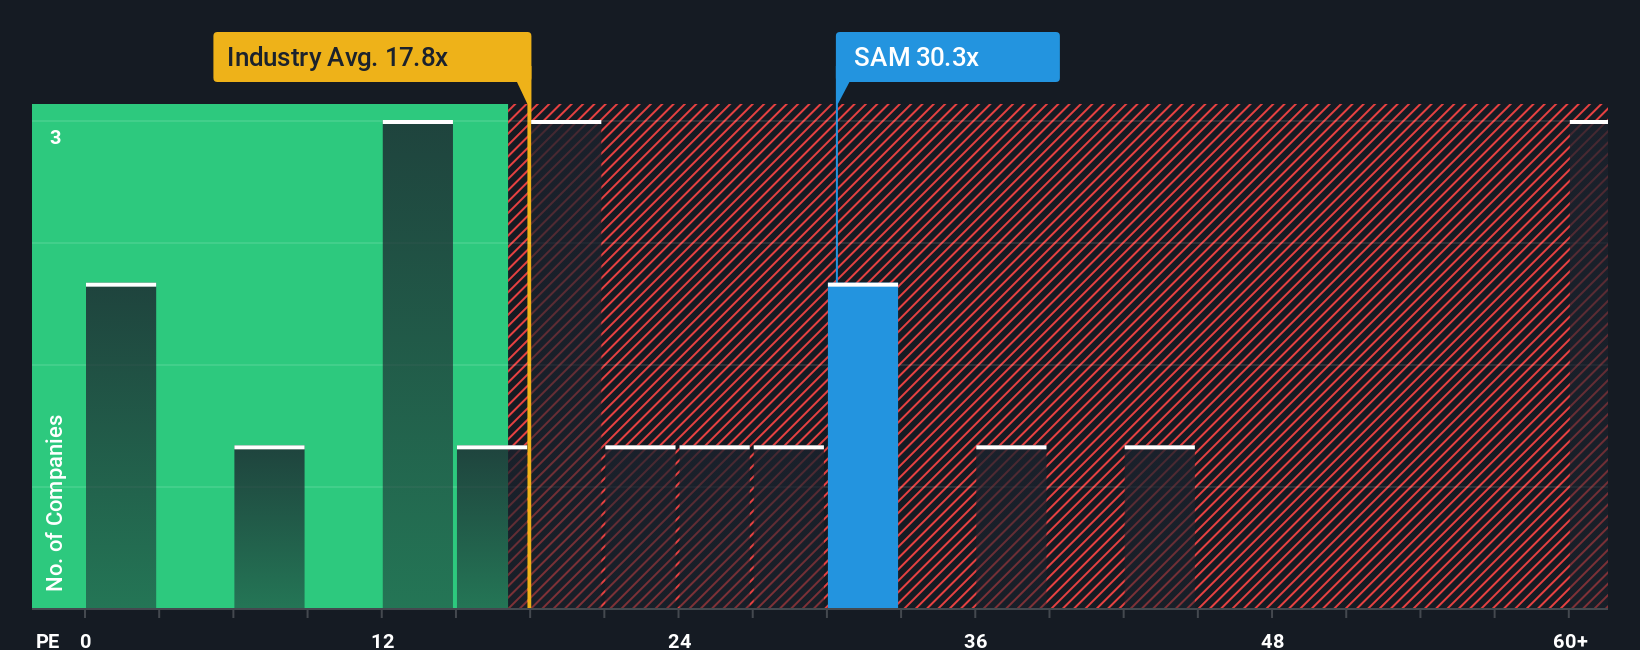
Another View: What Do Earnings Multiples Say?
The story changes when you look at Boston Beer through its P/E. At 23.8x, the stock trades above the global beverage industry at 17.8x and above its own fair ratio of 15.8x, even though it sits below the peer average of 28.2x. Is that a premium you are comfortable paying?
See what the numbers say about this price — find out in our valuation breakdown.
Build Your Own Boston Beer Company Narrative
If you look at the numbers and reach a different conclusion, or simply prefer to test your own assumptions, you can build a complete thesis in just a few minutes with Do it your way.
A great starting point for your Boston Beer Company research is our analysis highlighting 3 key rewards and 1 important warning sign that could impact your investment decision.
Looking for more investment ideas?
If Boston Beer is only one piece of your watchlist, do not stop here. Use the Screener to spot other ideas before the crowd piles in.
- Tap into income potential by scanning these 14 dividend stocks with yields > 3% that might suit a yield focused approach.
- Spot future tech trends early by zeroing in on these 24 AI penny stocks tied to artificial intelligence themes.
- Hunt for mispriced opportunities with these 866 undervalued stocks based on cash flows that align with your view on cash flow strength.
This article by Simply Wall St is general in nature. We provide commentary based on historical data and analyst forecasts only using an unbiased methodology and our articles are not intended to be financial advice. It does not constitute a recommendation to buy or sell any stock, and does not take account of your objectives, or your financial situation. We aim to bring you long-term focused analysis driven by fundamental data. Note that our analysis may not factor in the latest price-sensitive company announcements or qualitative material. Simply Wall St has no position in any stocks mentioned.
Have feedback on this article? Concerned about the content? Get in touch with us directly. Alternatively, email editorial-team@simplywallst.com