
- If you are wondering whether Synopsys is attractively priced today, you are not alone. The stock has attracted a lot of attention from investors trying to make sense of its current value.
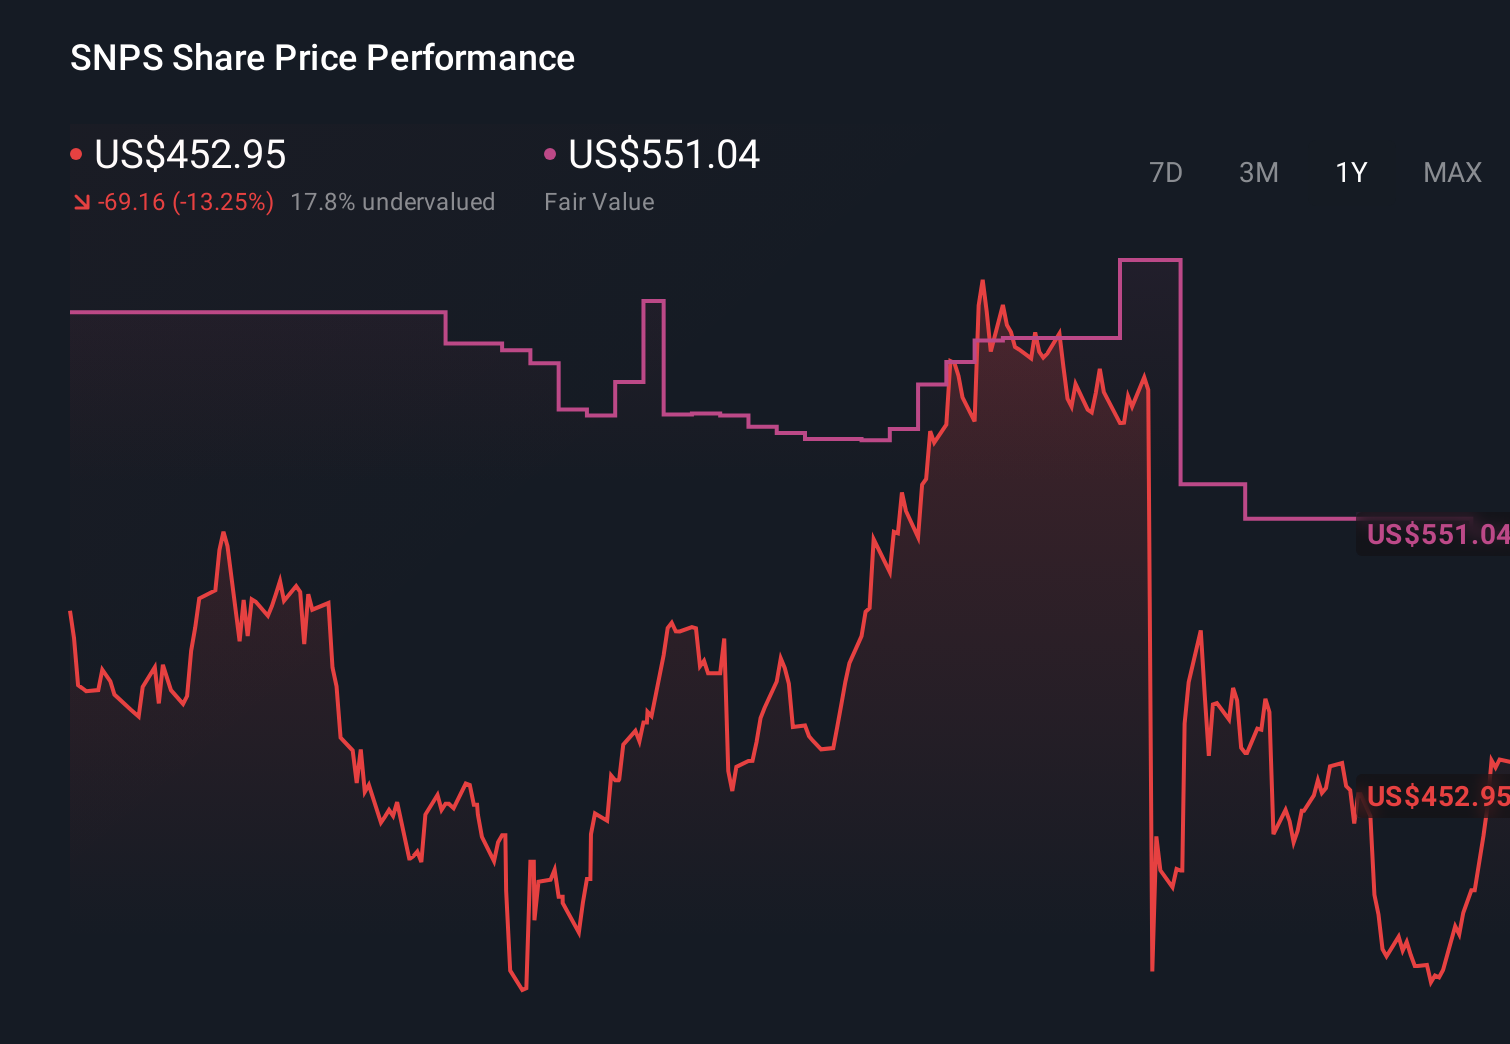
- The share price recently closed at US$511.35, with returns of 6.8% over the last 30 days, 6.4% year to date, and 39.3% over 3 years, while the 1-year return sits at a slight 0.3% decline and the 7-day return at a 2.0% decline.
- Recent coverage has focused on Synopsys as a key software name in semiconductor design, alongside ongoing interest in companies linked to chip and automation themes. These news items help explain why the stock has seen mixed short-term moves while still attracting attention from long-term-focused investors.
- On our checks, Synopsys currently holds a valuation score of 0 out of 6. Next, we will look at how different valuation approaches assess the stock today, before finishing with a practical way to bring those methods together into a clearer picture.
Synopsys scores just 0/6 on our valuation checks. See what other red flags we found in the full valuation breakdown.
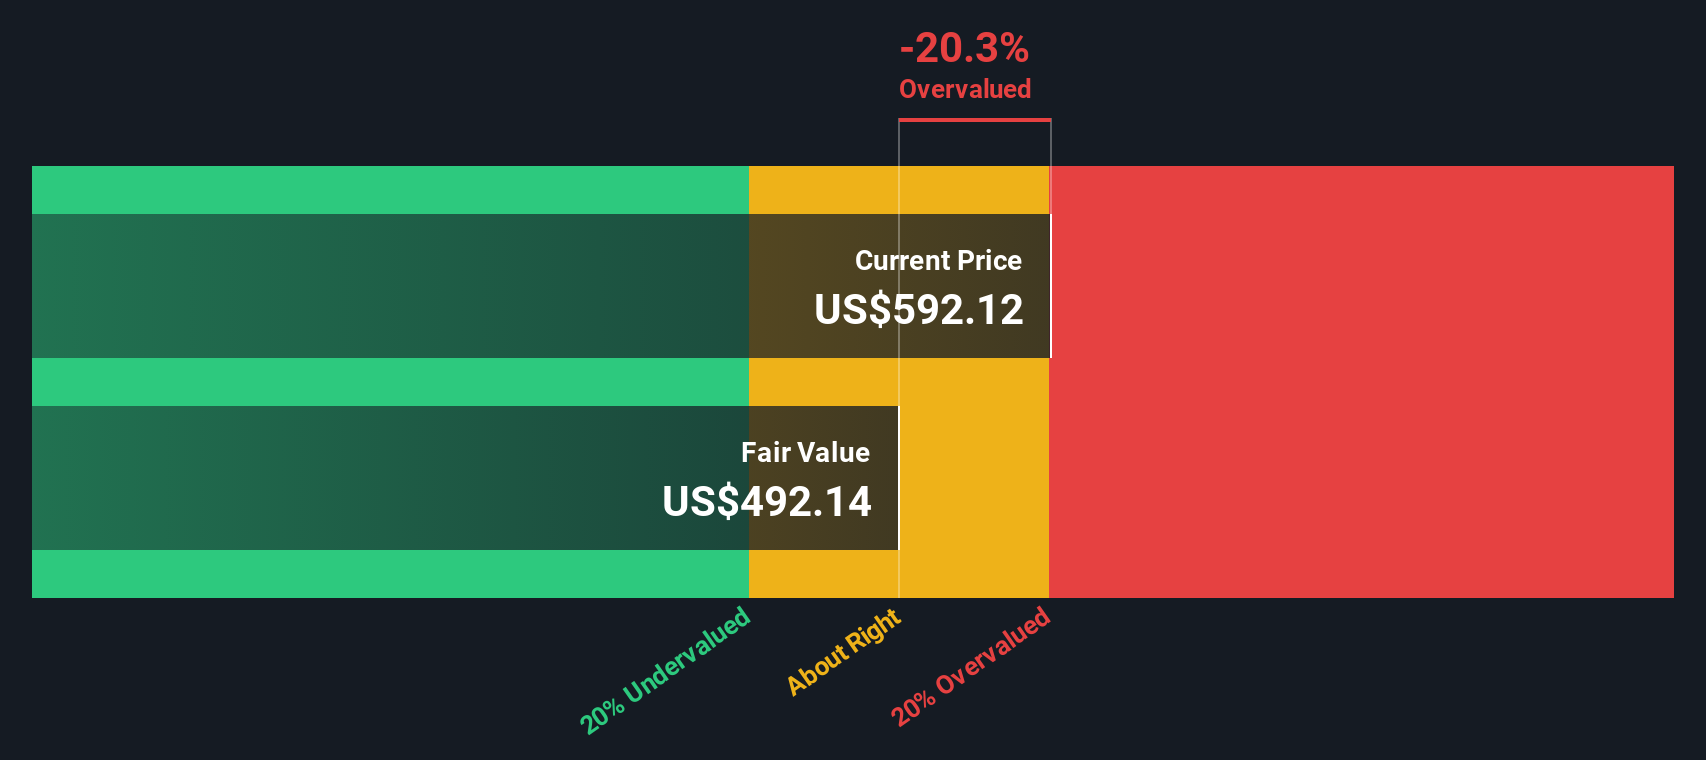
Approach 1: Synopsys Discounted Cash Flow (DCF) Analysis
A Discounted Cash Flow, or DCF, model estimates what a company could be worth by projecting its future cash flows and then discounting those back to today, using the idea that a dollar in the future is worth less than a dollar now.
For Synopsys, the model used is a 2 Stage Free Cash Flow to Equity approach. The latest twelve month free cash flow sits at about $1.33b. Analyst and extrapolated projections, provided in the model, point to free cash flow of $3.21b in 2028, with further annual projections out to 2035 supplied by Simply Wall St as part of the same framework.
Bringing all of those projected cash flows back to today produces an estimated intrinsic value of around $376.49 per share. Compared to the recent share price of $511.35, the DCF output indicates Synopsys is around 35.8% above this modelled value. Based on this specific cash flow view, the stock screens as overvalued.
Result: OVERVALUED
Our Discounted Cash Flow (DCF) analysis suggests Synopsys may be overvalued by 35.8%. Discover 877 undervalued stocks or create your own screener to find better value opportunities.
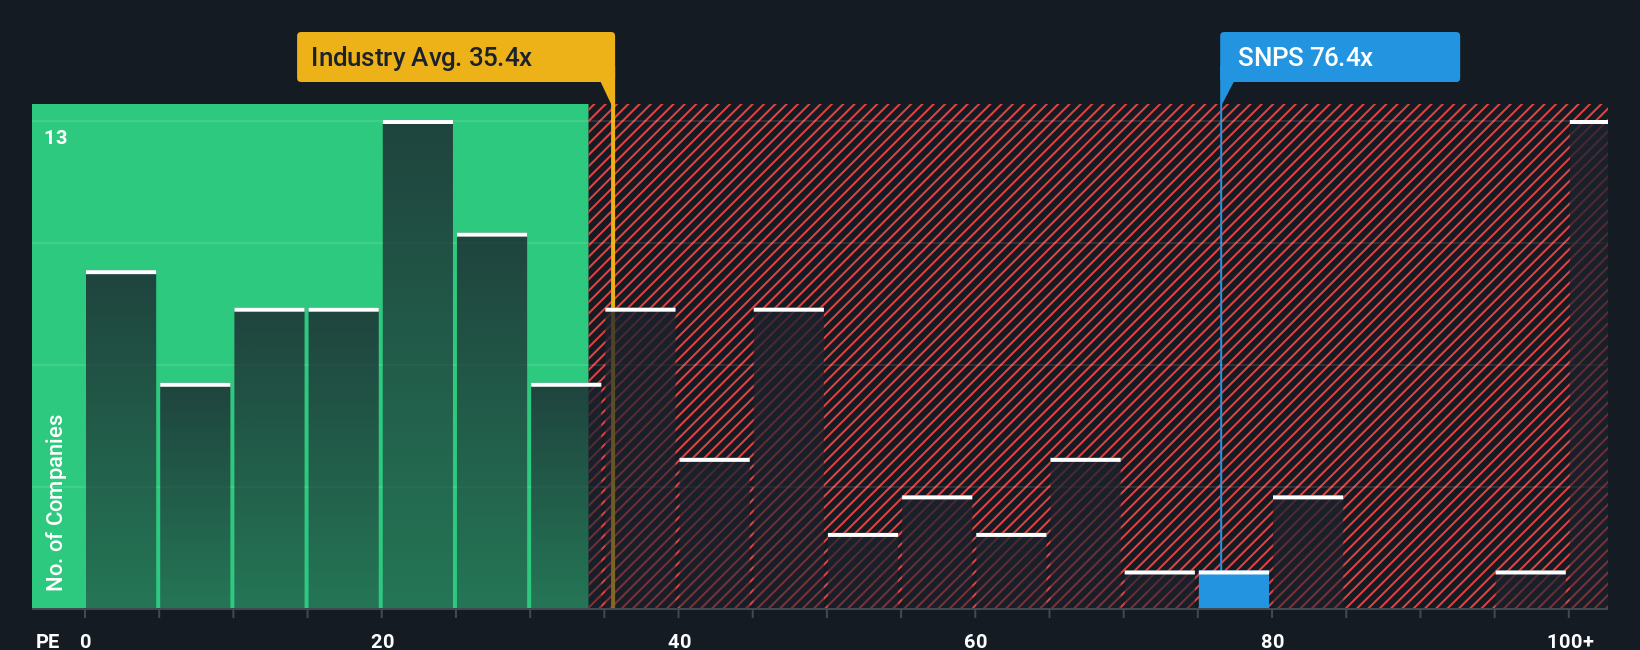
Approach 2: Synopsys Price vs Earnings
The P/E ratio is a common way to value profitable companies because it connects what you pay for each share with the earnings that company is currently generating. Higher growth expectations or lower perceived risk can justify a higher P/E, while slower growth or higher risk usually point to a lower, more conservative range.
Synopsys is currently trading on a P/E of 73.22x. That is well above the Software industry average of 30.41x and also above the peer group average of 46.74x. Simply Wall St uses a proprietary “Fair Ratio” framework to estimate what a more suitable P/E might be after accounting for factors like earnings growth, profitability, industry, market cap and risk profile. For Synopsys, that Fair Ratio is 41.42x.
This Fair Ratio can be more informative than a simple comparison with industry or peers, because it adjusts for company specific characteristics rather than assuming that all software companies should trade on similar multiples. With Synopsys trading at 73.22x against a Fair Ratio of 41.42x, this multiple-based view currently suggests that the shares are expensive relative to that fitted range.
Result: OVERVALUED
P/E ratios tell one story, but what if the real opportunity lies elsewhere? Discover 1417 companies where insiders are betting big on explosive growth.
Upgrade Your Decision Making: Choose your Synopsys Narrative
Earlier we mentioned that there is an even better way to understand valuation, so let us introduce you to Narratives, a way to connect your view of Synopsys with the numbers behind it.
A Narrative is simply your story for the company, where you spell out what you think is reasonable for future revenue, earnings and profit margins, and then link that to an assumed fair value. On Simply Wall St, Narratives sit inside the Community page and are designed to be easy to set up. This means you can move from “I like this business” to a clear financial forecast and a fair value estimate that suits your own view of the stock.
Once you have a Narrative, you can compare your Fair Value to the current share price to help decide whether Synopsys looks more attractive, less attractive, or somewhere in between. The platform updates that view automatically when new news or earnings are added. For example, some Synopsys Narratives on the platform currently assume a relatively high fair value while others assume a much lower figure, which shows how different investors can look at the same company and still reach very different conclusions.
Do you think there's more to the story for Synopsys? Head over to our Community to see what others are saying!
This article by Simply Wall St is general in nature. We provide commentary based on historical data and analyst forecasts only using an unbiased methodology and our articles are not intended to be financial advice. It does not constitute a recommendation to buy or sell any stock, and does not take account of your objectives, or your financial situation. We aim to bring you long-term focused analysis driven by fundamental data. Note that our analysis may not factor in the latest price-sensitive company announcements or qualitative material. Simply Wall St has no position in any stocks mentioned.
Have feedback on this article? Concerned about the content? Get in touch with us directly. Alternatively, email editorial-team@simplywallst.com