
- If you are wondering whether Amentum Holdings is priced attractively right now, the recent share moves give you some useful clues to work with.
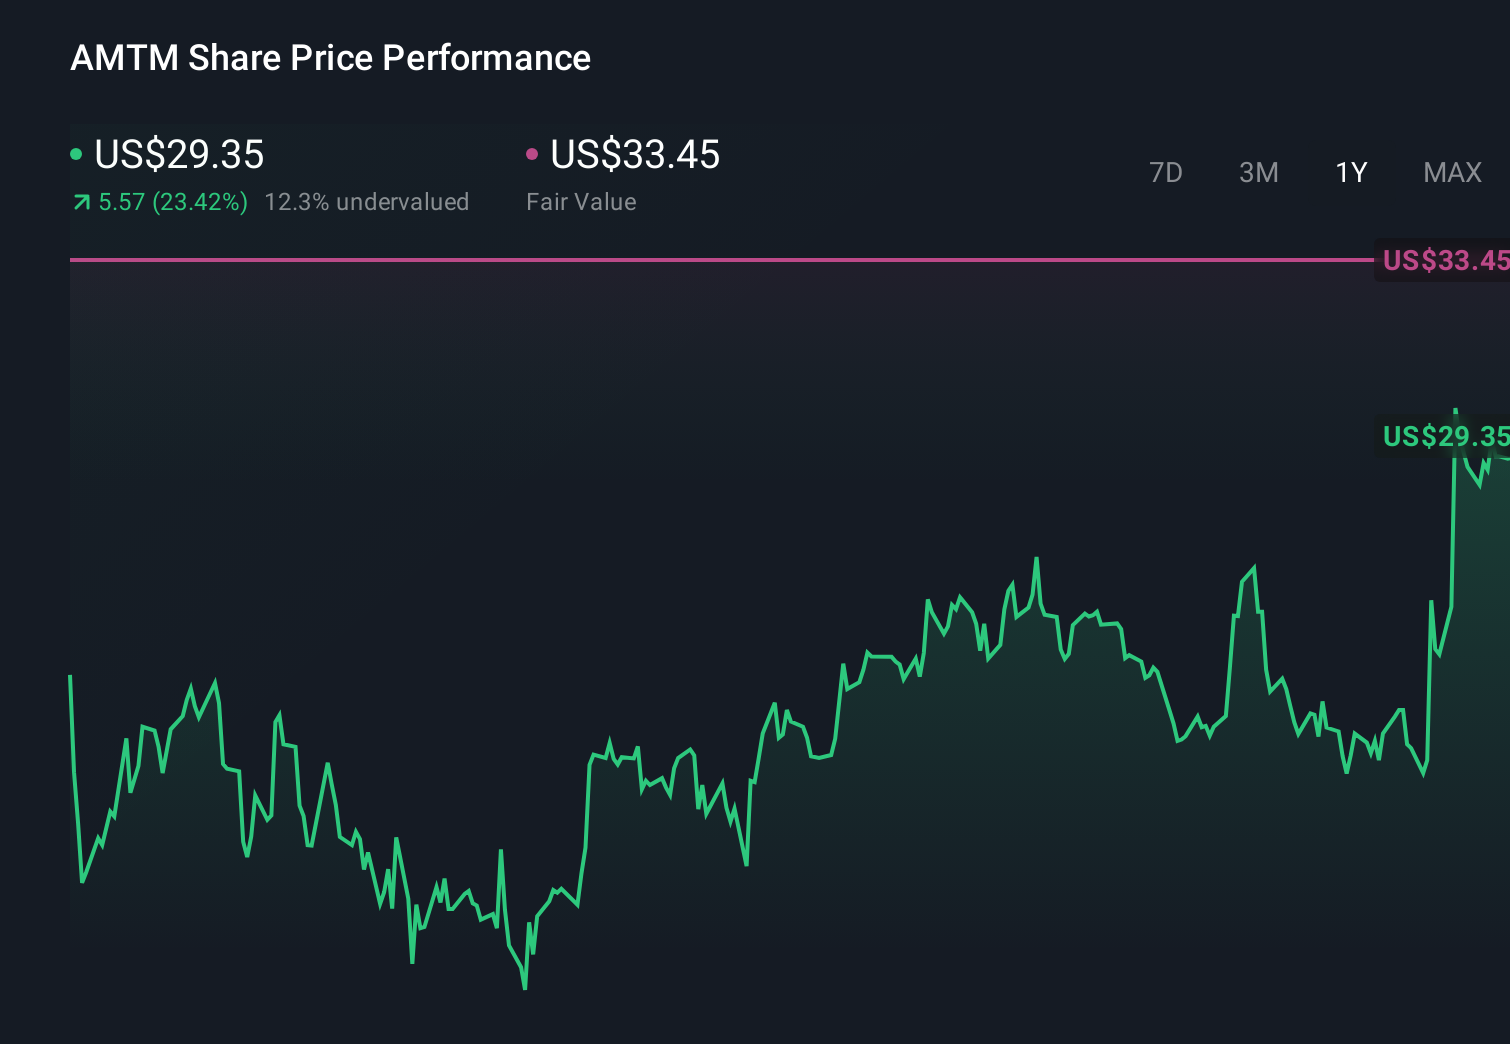
- The stock last closed at US$35.56, with returns of 2.8% over the past week, 20.7% over the past month, 16.7% year to date and 63.9% over the past year, which has likely shifted how some investors view both its potential and its risks.
- Recent news around Amentum has focused on its position as a listed government and commercial services provider, as investors weigh its contract exposure and long term demand drivers. This backdrop helps explain why the share price has been active over different time frames as the market reassesses what the business might be worth.
- Even so, our valuation model currently gives Amentum Holdings a 2 out of 6 valuation score. The rest of this article will unpack how different valuation approaches line up on the stock and point you to a more complete way of judging value at the end.
Amentum Holdings scores just 2/6 on our valuation checks. See what other red flags we found in the full valuation breakdown.
Approach 1: Amentum Holdings Discounted Cash Flow (DCF) Analysis
A Discounted Cash Flow model takes estimates of the cash a business could generate in the future, then discounts those cash flows back to today to reach an implied value per share.
For Amentum Holdings, the model uses a 2 Stage Free Cash Flow to Equity approach, starting from last twelve months free cash flow of about $519.4 million. Analysts provide free cash flow estimates out to 2028, with Simply Wall St extrapolating projections further out to 2035. By 2035, the model uses an estimated free cash flow of about $1.1b, all expressed in US$ and discounted back to today.
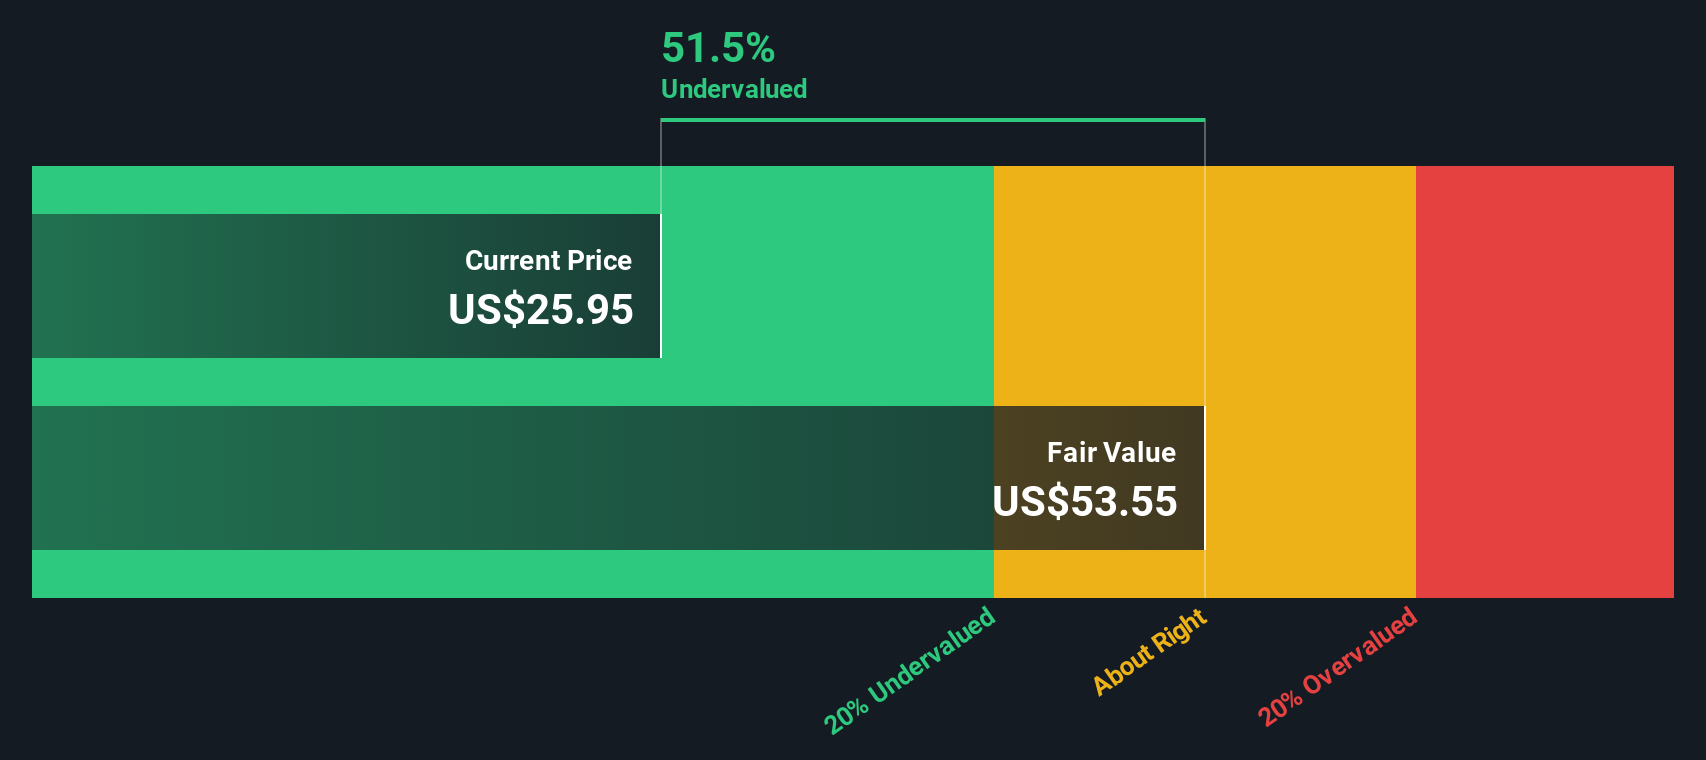
Pulling these projections together, the DCF output suggests an intrinsic value of about $69.69 per share, compared with the recent share price of $35.56. That implies the stock trades at roughly a 49.0% discount to this DCF estimate, which points to a material gap between the modelled value and the current market price.
Result: UNDERVALUED
Our Discounted Cash Flow (DCF) analysis suggests Amentum Holdings is undervalued by 49.0%. Track this in your watchlist or portfolio, or discover 878 more undervalued stocks based on cash flows.
Approach 2: Amentum Holdings Price vs Earnings
For profitable companies, the P/E ratio is a useful shorthand because it connects what you pay for the stock with the earnings the business is already generating. It helps you see how many dollars the market is willing to pay today for each dollar of current earnings.
What counts as a “normal” P/E depends on how the market views a company’s growth potential and risk. Higher expected growth and lower perceived risk can justify a higher P/E, while slower growth or higher risk tend to pull a fair P/E down.
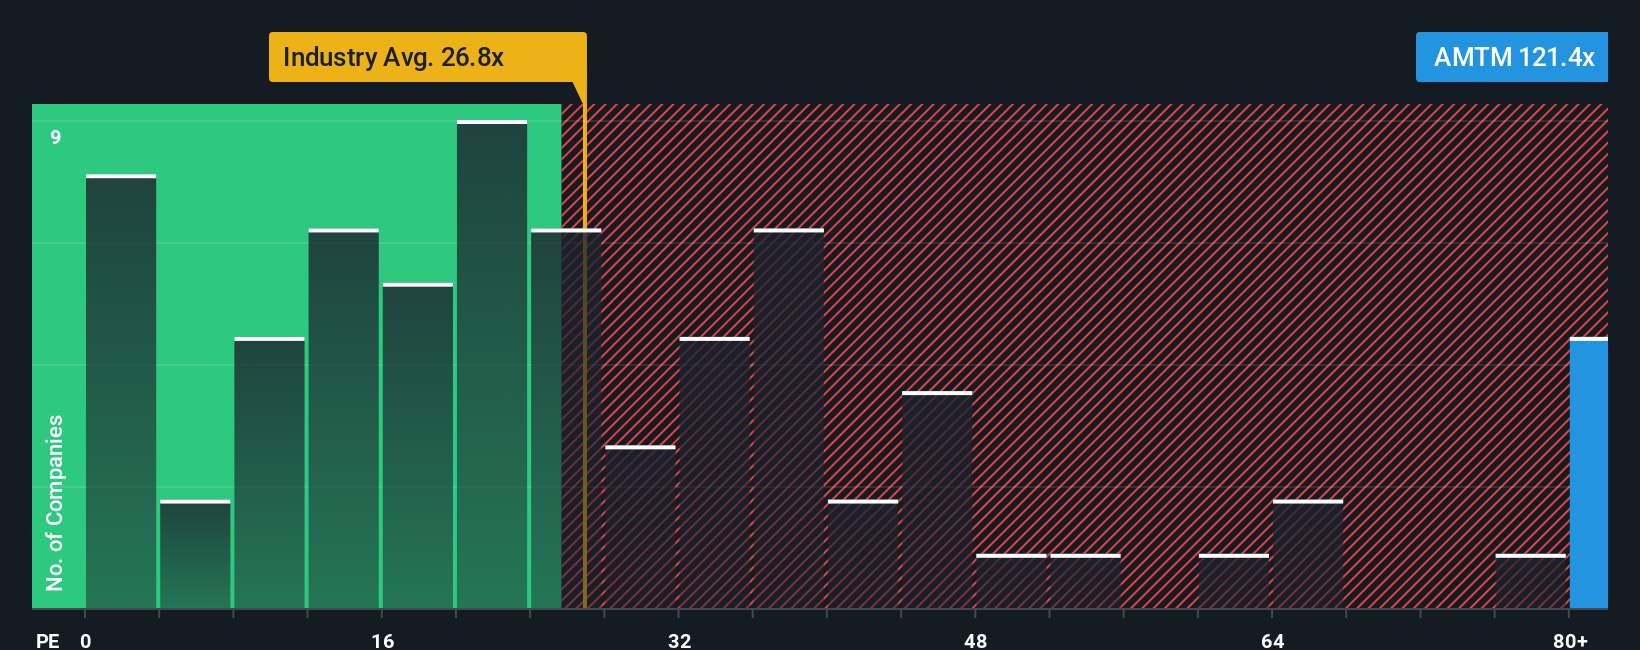
Amentum Holdings currently trades on a P/E of about 131.3x. That is well above the Professional Services industry average of 24.2x and also above the peer average of 21.9x. Simply Wall St’s Fair Ratio for Amentum, which estimates what the P/E “should” be after accounting for factors like earnings growth, industry, profit margin, market cap and risk, is 37.0x. This Fair Ratio is more tailored than a simple peer or industry comparison because it is built around Amentum’s own profile rather than broad group averages.
Compared with this Fair Ratio of 37.0x, the current P/E of 131.3x suggests the shares trade at a premium to what the model views as a more typical level.
Result: OVERVALUED
P/E ratios tell one story, but what if the real opportunity lies elsewhere? Discover 1428 companies where insiders are betting big on explosive growth.
Upgrade Your Decision Making: Choose your Amentum Holdings Narrative
Earlier we mentioned that there is an even better way to understand valuation, so let us introduce you to Narratives, a simple way for you to attach a story to your numbers such as your assumed fair value and your expectations for future revenue, earnings and margins.
A Narrative links how you see a company’s business story to a financial forecast and then to a fair value estimate, so you can quickly compare that fair value with the current share price and decide whether Amentum Holdings looks attractive or not on your terms.
On Simply Wall St, Narratives sit inside the Community page and are used by millions of investors. This gives you an accessible tool that updates automatically when new information like news or earnings is added, so your story and numbers stay aligned without extra work.
For example, one Amentum Holdings Narrative might assume a higher long term revenue path and stronger margins that support a fair value well above US$35.56. Another might assume more modest growth and lower margins that point to a fair value closer to the recent price, showing how different investors can reasonably reach different conclusions using the same framework.
Do you think there's more to the story for Amentum Holdings? Head over to our Community to see what others are saying!
This article by Simply Wall St is general in nature. We provide commentary based on historical data and analyst forecasts only using an unbiased methodology and our articles are not intended to be financial advice. It does not constitute a recommendation to buy or sell any stock, and does not take account of your objectives, or your financial situation. We aim to bring you long-term focused analysis driven by fundamental data. Note that our analysis may not factor in the latest price-sensitive company announcements or qualitative material. Simply Wall St has no position in any stocks mentioned.
Have feedback on this article? Concerned about the content? Get in touch with us directly. Alternatively, email editorial-team@simplywallst.com