
As the U.S. market grapples with geopolitical tensions and fluctuating bond yields, small-cap stocks in the S&P 600 have shown resilience amid broader market volatility. With major indices like the Dow Jones and Nasdaq experiencing declines due to tariff threats, investors are increasingly turning their attention to lesser-known opportunities that may offer growth potential in uncertain times. In this context, identifying a good stock often involves looking for companies with strong fundamentals and innovative strategies that can navigate these challenging economic conditions effectively.
Top 10 Undiscovered Gems With Strong Fundamentals In The United States
| Name | Debt To Equity | Revenue Growth | Earnings Growth | Health Rating |
|---|---|---|---|---|
| First Bancorp | 57.63% | 1.47% | -2.43% | ★★★★★★ |
| Tri-County Financial Group | 102.20% | -2.69% | -15.63% | ★★★★★★ |
| Oakworth Capital | 40.91% | 15.96% | 11.47% | ★★★★★★ |
| Franklin Financial Services | 127.01% | 5.48% | -4.56% | ★★★★★★ |
| Affinity Bancshares | 43.06% | 2.84% | 3.44% | ★★★★★★ |
| First Northern Community Bancorp | NA | 7.79% | 11.96% | ★★★★★★ |
| ASA Gold and Precious Metals | NA | 13.18% | 16.77% | ★★★★★☆ |
| Seneca Foods | 41.64% | 2.31% | -23.77% | ★★★★★☆ |
| NameSilo Technologies | 12.63% | 14.48% | 3.12% | ★★★★★☆ |
| Pure Cycle | 5.42% | 9.36% | -2.03% | ★★★★★☆ |
Let's explore several standout options from the results in the screener.
Farmers National Banc (FMNB)
Simply Wall St Value Rating: ★★★★★★
Overview: Farmers National Banc Corp. is a bank holding company for The Farmers National Bank of Canfield, providing banking, trust, retirement consulting, insurance, and financial management services with a market cap of $509.45 million.
Operations: The primary revenue stream for Farmers National Banc Corp. comes from its Bank Segment, generating $128.70 million, followed by the Trust Segment at $14.04 million.
Farmers National Banc, with total assets of US$5.2 billion and equity of US$465.9 million, is a financial entity that stands out for its solid foundation. The bank's deposits amount to US$4.4 billion while loans are at US$3.3 billion, supported by a net interest margin of 2.7%. It maintains an allowance for bad loans at 1.1% of total loans, indicating prudent risk management practices with primarily low-risk funding sources accounting for 92% of liabilities. Recently, the company declared a quarterly dividend and completed share repurchases worth US$6.57 million under its buyback program announced in March 2023.
- Dive into the specifics of Farmers National Banc here with our thorough health report.
Evaluate Farmers National Banc's historical performance by accessing our past performance report.

Capitol Federal Financial (CFFN)
Simply Wall St Value Rating: ★★★★★☆
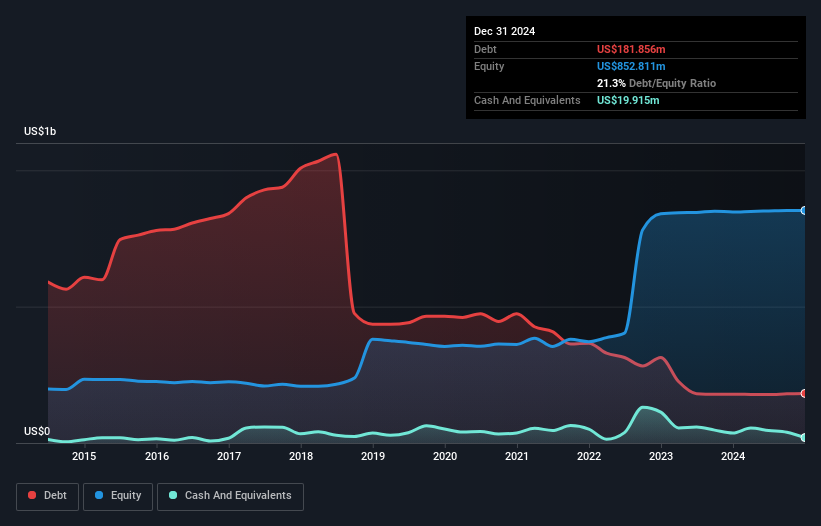
Overview: Capitol Federal Financial, Inc. is the holding company for Capitol Federal Savings Bank, offering a range of retail banking products and services across the United States, with a market capitalization of approximately $861.58 million.
Operations: Capitol Federal Financial generates revenue primarily through its community banking operations, amounting to $200.29 million.
Capitol Federal Financial, with total assets of US$9.8 billion and equity of US$1.0 billion, stands out for its robust earnings growth of 78.9% over the past year, outpacing the industry average of 18.1%. The firm has a price-to-earnings ratio of 12.7x, which is attractive compared to the broader US market's 19.4x. With deposits totaling US$6.6 billion and loans at US$8.1 billion, it maintains a net interest margin of 2%. Despite an insufficient allowance for bad loans at 0.6%, its funding is primarily low-risk from customer deposits, enhancing stability in operations.
Transcontinental Realty Investors (TCI)
Simply Wall St Value Rating: ★★★★☆☆
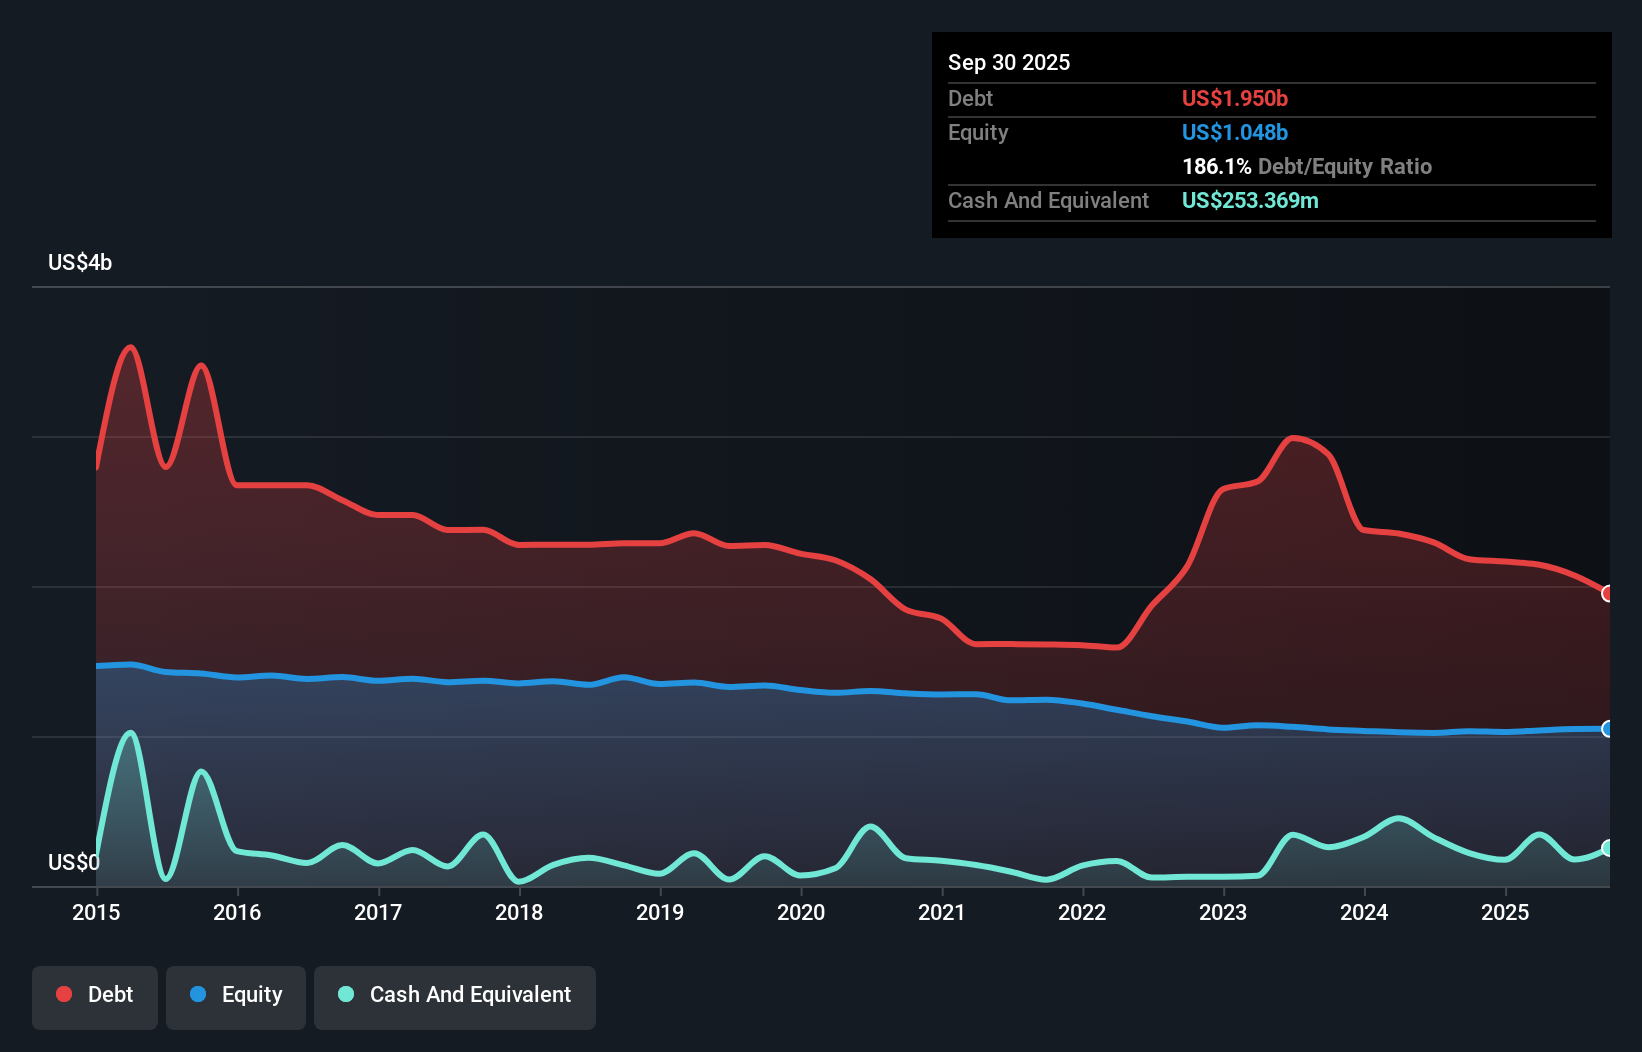
Overview: Transcontinental Realty Investors, Inc., headquartered in Dallas, is a real estate investment company with a diverse portfolio across the U.S. that includes office buildings, apartments, shopping centers, and land holdings; it has a market cap of approximately $457.19 million.
Operations: Transcontinental Realty Investors generates revenue primarily from its multifamily and commercial segments, with the multifamily segment contributing $34.44 million and the commercial segment $14.36 million.
Transcontinental Realty Investors, a smaller player in the real estate sector, has shown mixed results recently. Despite a 76% earnings growth over the past year, largely boosted by a one-off US$5 million gain, its five-year earnings trend reflects an annual decline of 5.2%. The company's net debt to equity ratio stands at a satisfactory 24.7%, significantly improved from 122.9% five years ago. However, free cash flow remains negative and interest coverage data is insufficient to assess financial health fully. Recent revenue for Q3 was US$12.84 million with net income at US$0.72 million compared to last year's figures of US$11.61 million and US$1.71 million respectively.
- Click here to discover the nuances of Transcontinental Realty Investors with our detailed analytical health report.
Learn about Transcontinental Realty Investors' historical performance.
Summing It All Up
- Investigate our full lineup of 295 US Undiscovered Gems With Strong Fundamentals right here.
- Invested in any of these stocks? Simplify your portfolio management with Simply Wall St and stay ahead with our alerts for any critical updates on your stocks.
- Enhance your investing ability with the Simply Wall St app and enjoy free access to essential market intelligence spanning every continent.
Searching for a Fresh Perspective?
- Explore high-performing small cap companies that haven't yet garnered significant analyst attention.
- Fuel your portfolio with companies showing strong growth potential, backed by optimistic outlooks both from analysts and management.
- Find companies with promising cash flow potential yet trading below their fair value.
This article by Simply Wall St is general in nature. We provide commentary based on historical data and analyst forecasts only using an unbiased methodology and our articles are not intended to be financial advice. It does not constitute a recommendation to buy or sell any stock, and does not take account of your objectives, or your financial situation. We aim to bring you long-term focused analysis driven by fundamental data. Note that our analysis may not factor in the latest price-sensitive company announcements or qualitative material. Simply Wall St has no position in any stocks mentioned.
Have feedback on this article? Concerned about the content? Get in touch with us directly. Alternatively, email editorial-team@simplywallst.com