
- If you are wondering whether Progyny's current share price lines up with its underlying worth, you are not alone. That is exactly what this article will unpack.
- The stock recently closed at US$24.31, with returns of 17.9% over 1 year but declines of 11.4% over 7 days, 6.5% over 30 days, 5.6% year to date, 27.0% over 3 years and 48.6% over 5 years, which may have shifted how some investors think about its risk and reward profile.
- These mixed returns have kept Progyny on the radar for investors who are weighing up growth potential against past pullbacks. Evergreen interest in the fertility benefits space and ongoing attention from market commentators continue to give context to recent share price moves, even without a single headline event driving the story.
- On our valuation checks, Progyny scores 3 out of 6. Next we will walk through what different valuation methods say about that number, before finishing with a way to look at value that many investors find even more useful.
Approach 1: Progyny Discounted Cash Flow (DCF) Analysis
A DCF model takes estimates of a company’s future cash flows and discounts them back to today, aiming to work out what those future dollars are worth in present terms.
For Progyny, the model uses a 2 Stage Free Cash Flow to Equity approach based on projected Free Cash Flow in $. The latest twelve month Free Cash Flow is about $199.8 million. Analyst and extrapolated projections in the model run through to 2035, with the 2030 estimate at $259.6 million, and each future year is discounted back so that later cash flows count for less than nearer term ones.
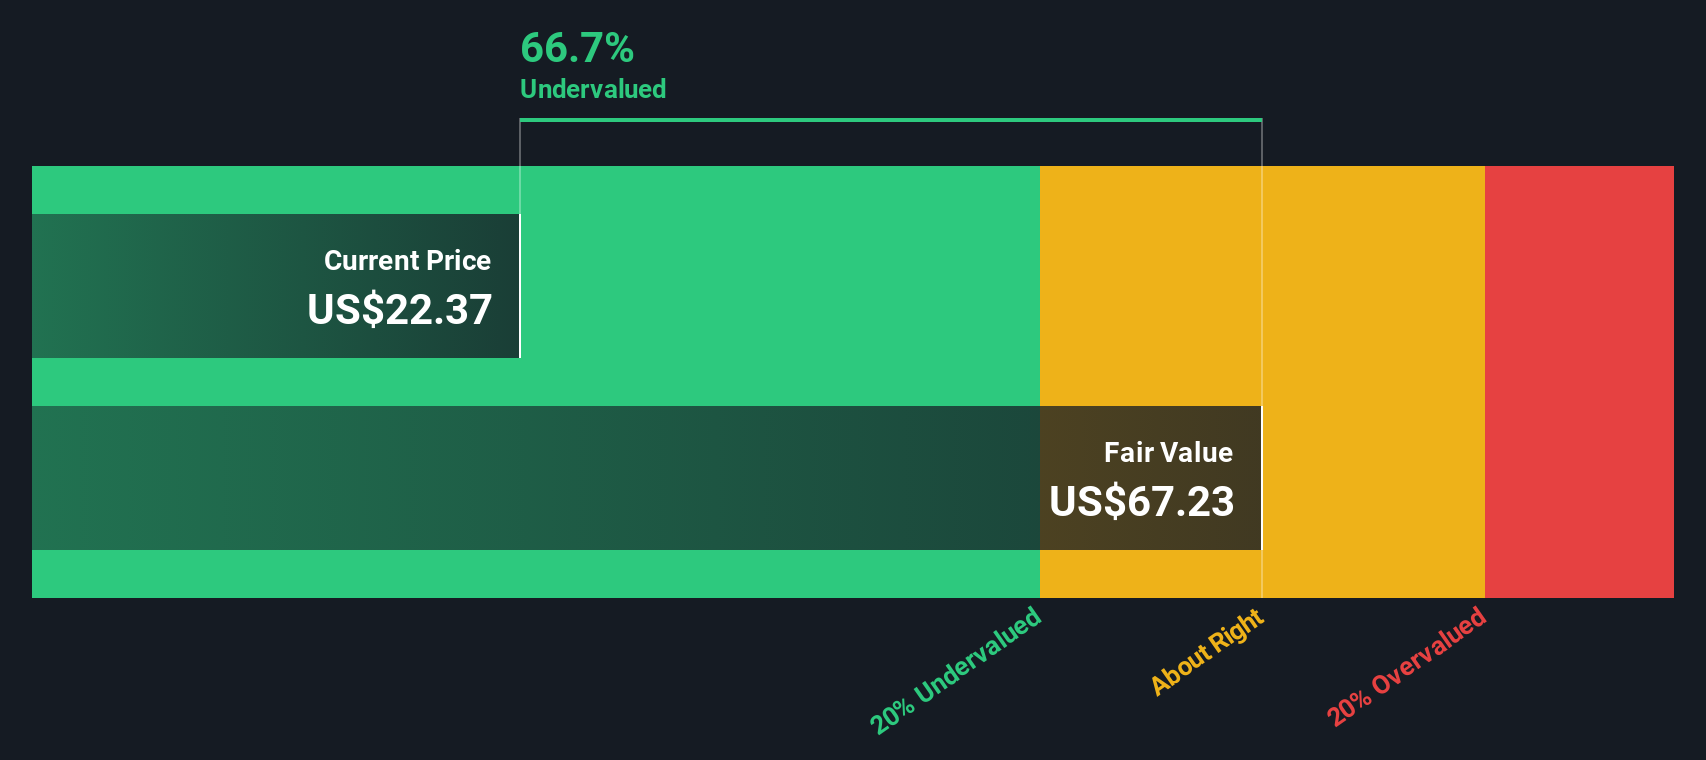
Adding up these discounted cash flows gives an estimated intrinsic value of US$74.28 per share under this DCF framework. Relative to the recent share price of US$24.31, the model output suggests Progyny is around 67.3% undervalued on these assumptions.
Result: UNDERVALUED
Our Discounted Cash Flow (DCF) analysis suggests Progyny is undervalued by 67.3%. Track this in your watchlist or portfolio, or discover 869 more undervalued stocks based on cash flows.
Approach 2: Progyny Price vs Earnings
For profitable companies, the P/E ratio is a useful way to think about what you are paying for each dollar of current earnings, which makes it a common shorthand for how the market is pricing a business today.
What counts as a “normal” P/E often reflects how the market weighs two things: expected earnings growth and perceived risk. Higher expected growth or lower perceived risk can support a higher P/E, while lower growth expectations or higher risk usually line up with a lower multiple.
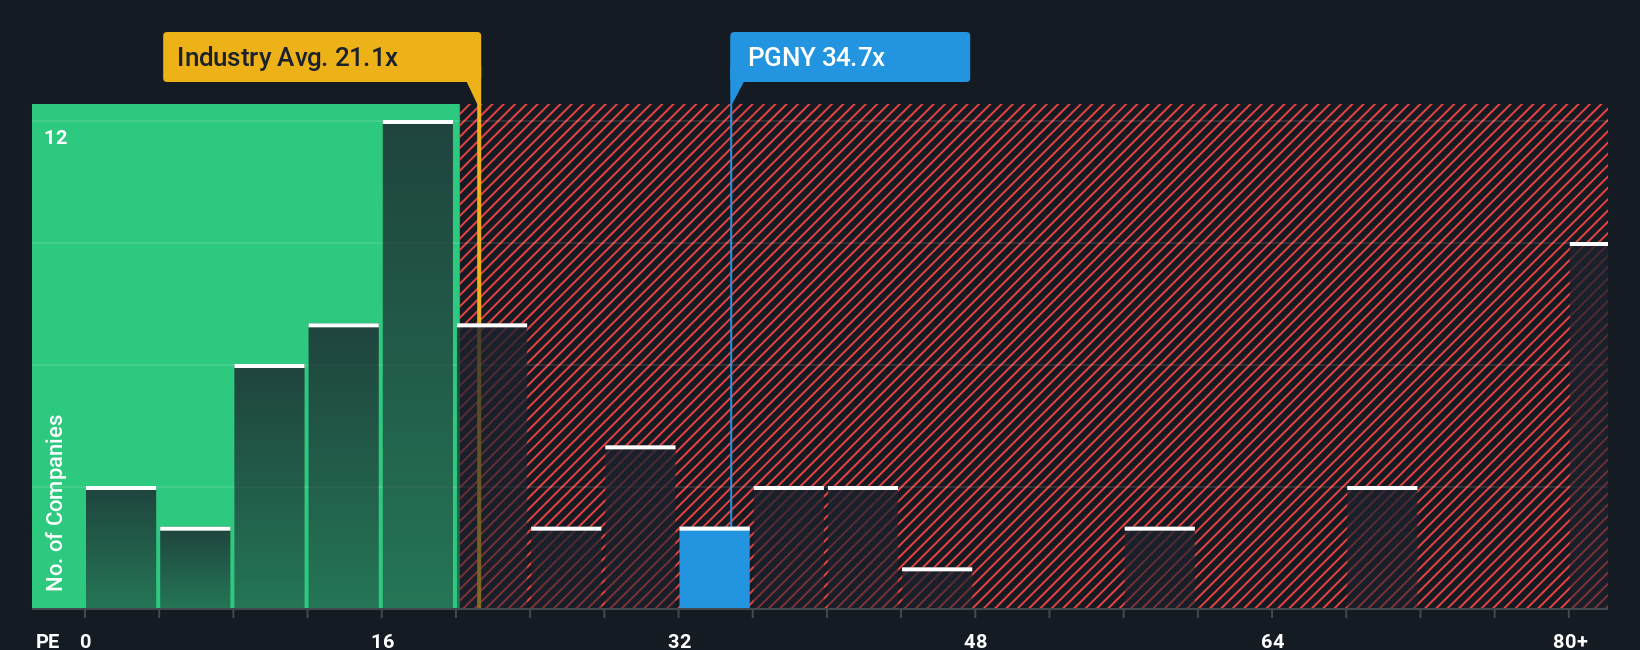
Progyny currently trades on a P/E of 37.05x, compared with the Healthcare industry average of about 23.44x and a peer average of 22.95x. Simply Wall St’s Fair Ratio for Progyny is 22.92x, which is its proprietary view of what the P/E might be given factors such as earnings growth profile, profit margins, industry, market cap and company specific risks.
This Fair Ratio aims to be more tailored than a simple peer or industry comparison because it adjusts for Progyny’s own characteristics rather than assuming that all Healthcare names deserve similar multiples. Set against the current P/E of 37.05x, the Fair Ratio of 22.92x suggests Progyny’s shares are trading above that model based estimate of fair value on an earnings basis.
Result: OVERVALUED
P/E ratios tell one story, but what if the real opportunity lies elsewhere? Discover 1444 companies where insiders are betting big on explosive growth.
Upgrade Your Decision Making: Choose your Progyny Narrative
Earlier we mentioned that there is an even better way to think about valuation. On Simply Wall St that starts with Narratives, where you spell out your story for Progyny, translate that story into assumptions for future revenue, earnings and margins, connect those to a fair value, and then compare that fair value to today’s price on the Community page that millions of investors use. Your Narrative is automatically refreshed when new earnings or news arrive. For example, one investor might lean toward a higher fair value closer to the US$32.00 bullish target, while another anchors near the US$23.00 bearish view. Both can clearly see how their story, numbers and valuation link together when deciding whether the current price around US$24.31 looks attractive or not for their own approach.
Do you think there's more to the story for Progyny? Head over to our Community to see what others are saying!

This article by Simply Wall St is general in nature. We provide commentary based on historical data and analyst forecasts only using an unbiased methodology and our articles are not intended to be financial advice. It does not constitute a recommendation to buy or sell any stock, and does not take account of your objectives, or your financial situation. We aim to bring you long-term focused analysis driven by fundamental data. Note that our analysis may not factor in the latest price-sensitive company announcements or qualitative material. Simply Wall St has no position in any stocks mentioned.
Have feedback on this article? Concerned about the content? Get in touch with us directly. Alternatively, email editorial-team@simplywallst.com