
- Wondering if MetLife is still a smart buy at today’s price, or if most of the upside has already been taken? This breakdown will help you decide whether the stock looks cheap, fair, or fully valued.
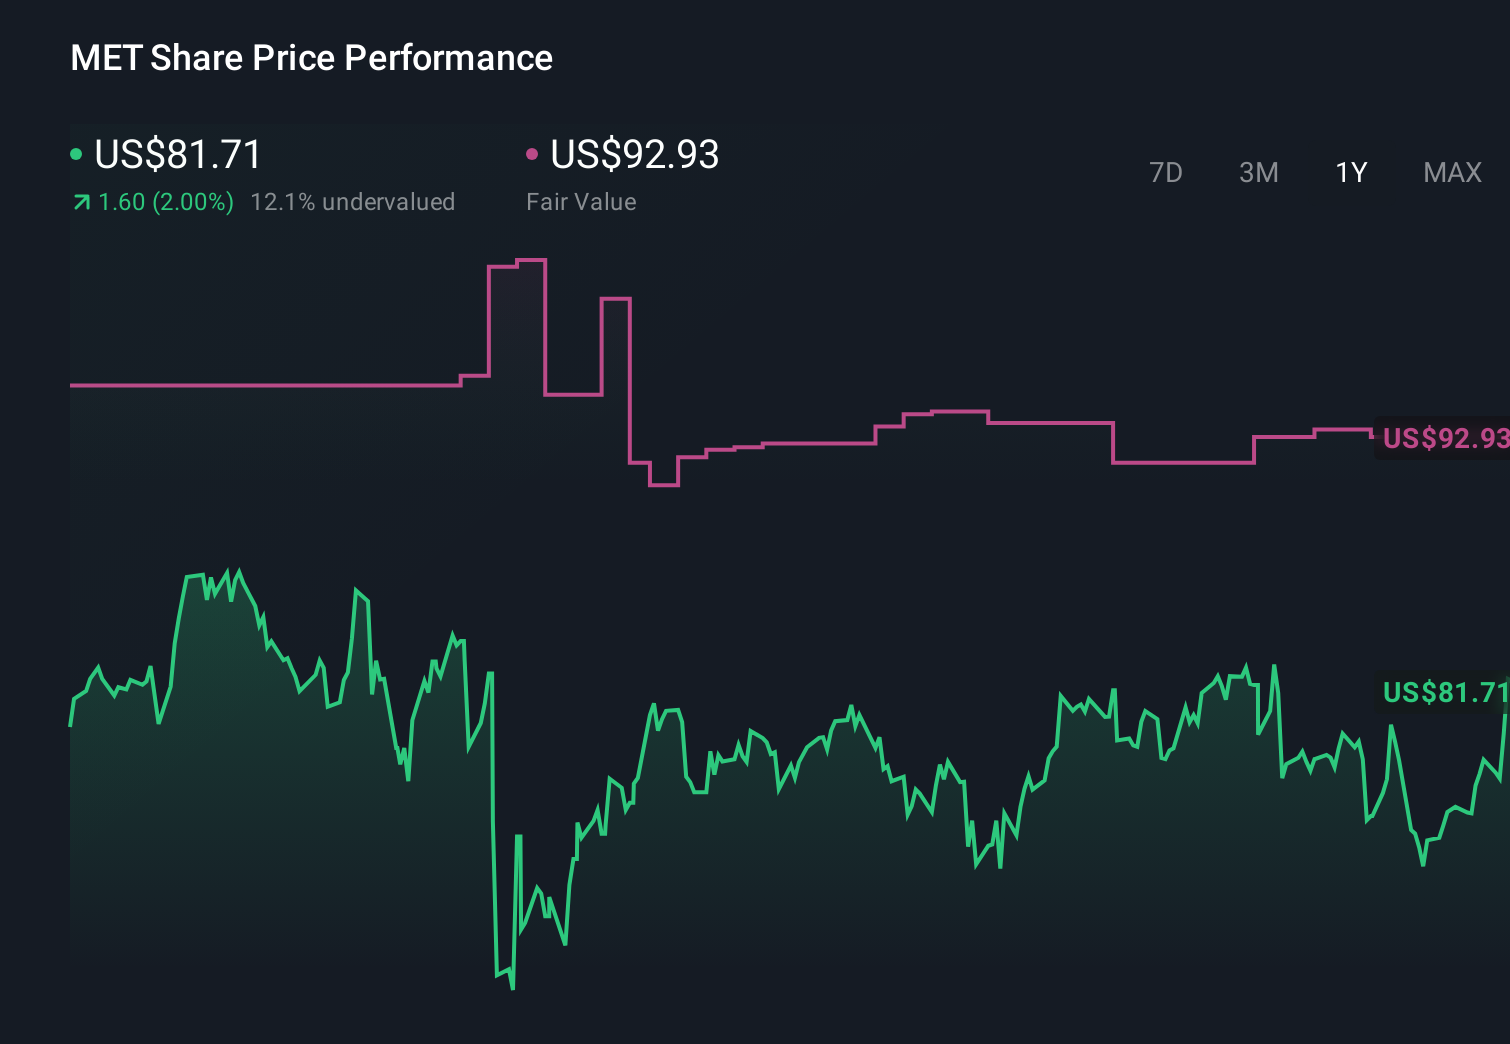
- The share price has climbed roughly 3.4% over the past week and about 9.3% in the last 30 days, while longer term gains of 24.3% over 3 years and 108.7% over 5 years show it has rewarded patient investors.
- Recent attention around MetLife has focused on its ongoing capital return plans and balance sheet strength, alongside regulatory developments that continue to shape the broader insurance sector. Together, these themes have helped investors reassess both the growth runway and the risk profile for a large, diversified insurer like MetLife.
- Right now, MetLife scores a 3 out of 6 on our valuation checks, suggesting it looks undervalued on several, but not all, of the metrics we track. Next, we will unpack what each major valuation approach says about the stock before exploring a more holistic way to judge its true worth by the end of the article.
Approach 1: MetLife Excess Returns Analysis
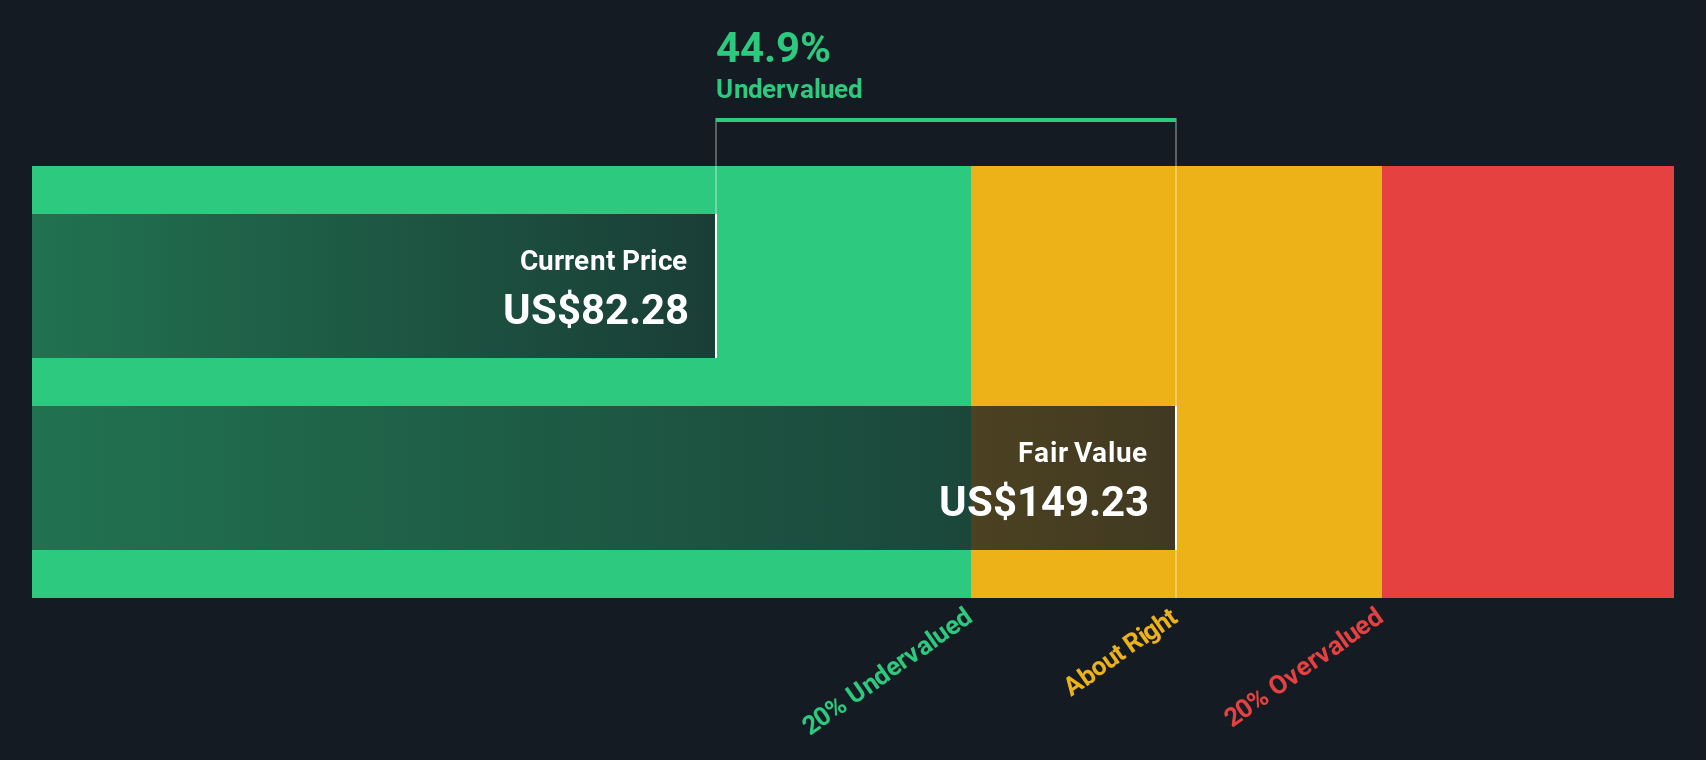
The Excess Returns model looks at how effectively MetLife turns shareholders’ equity into profits above its required cost of capital, then projects how long those extra returns can be sustained.
MetLife currently has an estimated Book Value of $43.81 per share and a Stable EPS of $6.96 per share, based on weighted future Return on Equity estimates from 6 analysts. With a Cost of Equity of $3.09 per share, the company is expected to generate an Excess Return of $3.87 per share, supported by an Average Return on Equity of 15.67%. Analysts also see Stable Book Value edging up to $44.44 per share over time, based on the same weighted future estimates.
Using these inputs in the Excess Returns framework results in an intrinsic value that is around 44.7% above the current share price. On this basis, the stock appears materially undervalued rather than just slightly mispriced.
Result: UNDERVALUED
Our Excess Returns analysis suggests MetLife is undervalued by 44.7%. Track this in your watchlist or portfolio, or discover 913 more undervalued stocks based on cash flows.
Approach 2: MetLife Price vs Earnings
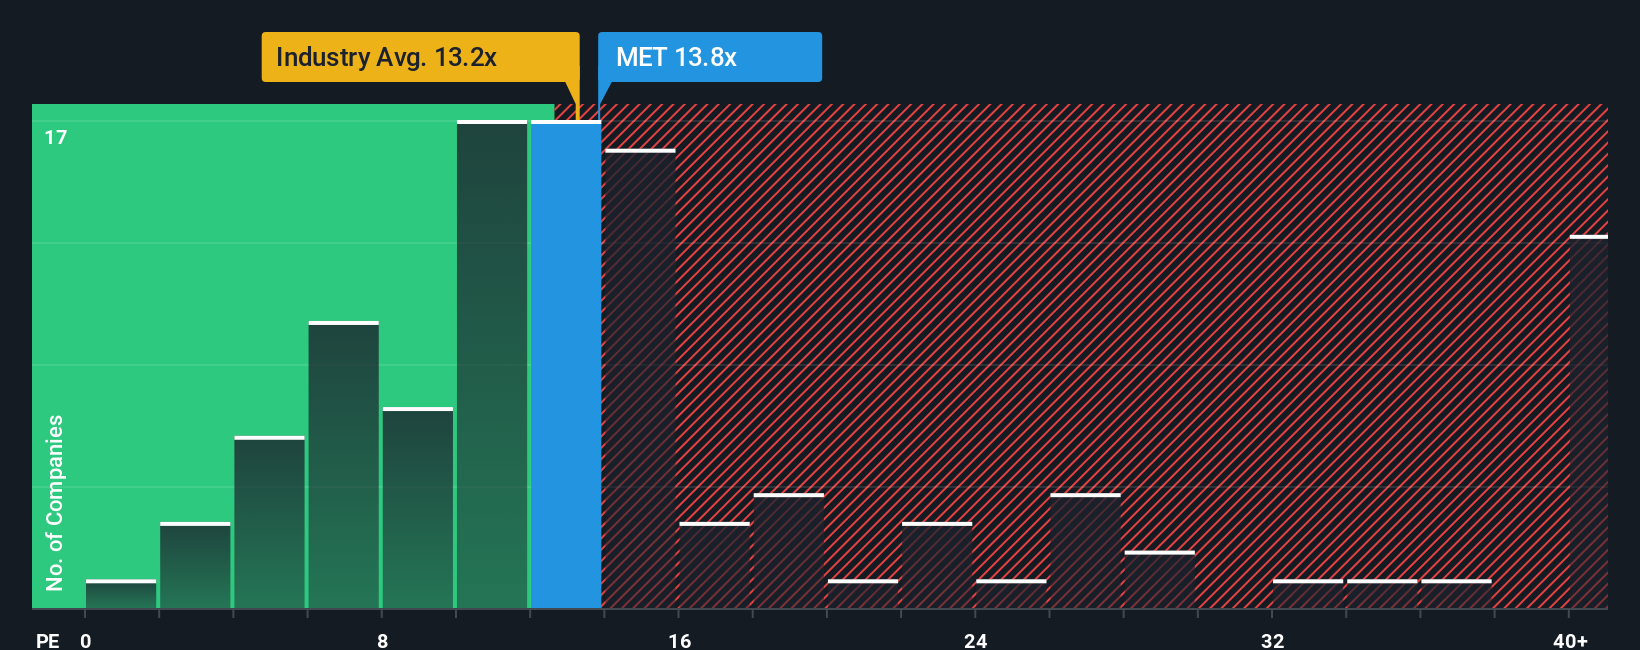
For a profitable, mature insurer like MetLife, the price to earnings ratio is a natural way to judge valuation, because it links what investors pay today to the company’s proven ability to generate profits. In general, companies with stronger, more reliable growth and lower perceived risk tend to justify a higher, or premium, PE multiple, while slower growing or riskier firms usually trade at a discount.
MetLife currently trades on a PE of 15.0x, modestly above the broader Insurance industry average of about 13.4x and slightly ahead of its peer group average of 14.1x. To move beyond simple comparisons, Simply Wall St calculates a Fair Ratio, an estimate of the PE multiple MetLife should command given its earnings growth outlook, profitability, industry, size and risk profile. This tailored Fair Ratio for MetLife is 17.1x, which is more nuanced than a straight peer or industry comparison because it explicitly factors in the company’s own strengths and risk characteristics.
Comparing the current 15.0x PE with the 17.1x Fair Ratio suggests the market is applying a discount to what MetLife’s fundamentals would typically warrant, and this highlights potential upside if that gap closes.
Result: UNDERVALUED
PE ratios tell one story, but what if the real opportunity lies elsewhere? Discover 1462 companies where insiders are betting big on explosive growth.
Upgrade Your Decision Making: Choose your MetLife Narrative
Earlier we mentioned that there is an even better way to understand valuation, so let us introduce you to Narratives, an easy tool on Simply Wall St’s Community page. It lets you attach a clear story about MetLife’s future to specific forecasts for revenue, earnings, margins and ultimately fair value. You can see in one place how your view of its international expansion, digital investments and retirement income opportunities translates into numbers. You can then compare that fair value with today’s share price to decide whether to buy, hold or sell and watch your assumptions update dynamically as new news or earnings arrive. You can also see how other investors can look at the same facts and reach very different conclusions. For example, one Narrative might assume MetLife’s global growth, margin expansion and capital-light strategy support a fair value closer to the higher analyst target of about $108. A more cautious Narrative that focuses on interest rate risk, underwriting volatility and commercial real estate exposure could point to a fair value nearer the lower end of roughly $72. This gives you a clear, side by side view of how different stories drive different valuations.
Do you think there's more to the story for MetLife? Head over to our Community to see what others are saying!
This article by Simply Wall St is general in nature. We provide commentary based on historical data and analyst forecasts only using an unbiased methodology and our articles are not intended to be financial advice. It does not constitute a recommendation to buy or sell any stock, and does not take account of your objectives, or your financial situation. We aim to bring you long-term focused analysis driven by fundamental data. Note that our analysis may not factor in the latest price-sensitive company announcements or qualitative material. Simply Wall St has no position in any stocks mentioned.
Have feedback on this article? Concerned about the content? Get in touch with us directly. Alternatively, email editorial-team@simplywallst.com