
- Wondering if ServiceNow is starting to look like a deal after its big run over the past few years and recent pullback? You are not alone. This is exactly when valuation really starts to matter.
- The stock is down about 8.6% over the last week, 8.2% over the past month, and roughly 25.9% year to date, yet it is still up more than 100% over 3 years. This combination often signals shifting sentiment rather than a broken business.
- Recently, investors have been digesting macro worries around IT budgets and high growth software valuations, which has put pressure on many quality names like ServiceNow. At the same time, the company continues to expand its platform footprint and announce new workflow and AI capabilities with major enterprise customers. This helps explain why long term expectations remain high even as the share price cools.
- Our starting point is a valuation score of 2/6, suggesting ServiceNow screens as undervalued on only a couple of our standard checks. We will walk through what different valuation methods say, then finish by looking at a more nuanced way to judge whether the current price really makes sense.
ServiceNow scores just 2/6 on our valuation checks. See what other red flags we found in the full valuation breakdown.
Approach 1: ServiceNow Discounted Cash Flow (DCF) Analysis
A Discounted Cash Flow model estimates what a company is worth by projecting its future cash flows and then discounting those projections back to today in dollar terms.
ServiceNow generated about $3.9 billion in free cash flow over the last twelve months, a strong base for a mature but still growing software platform. Analysts and extrapolated estimates used in the 2 Stage Free Cash Flow to Equity model indicate free cash flow could reach roughly $14.6 billion by 2035, with interim projections such as around $9.4 billion by 2029 and $10.6 billion by 2030 as growth gradually moderates.
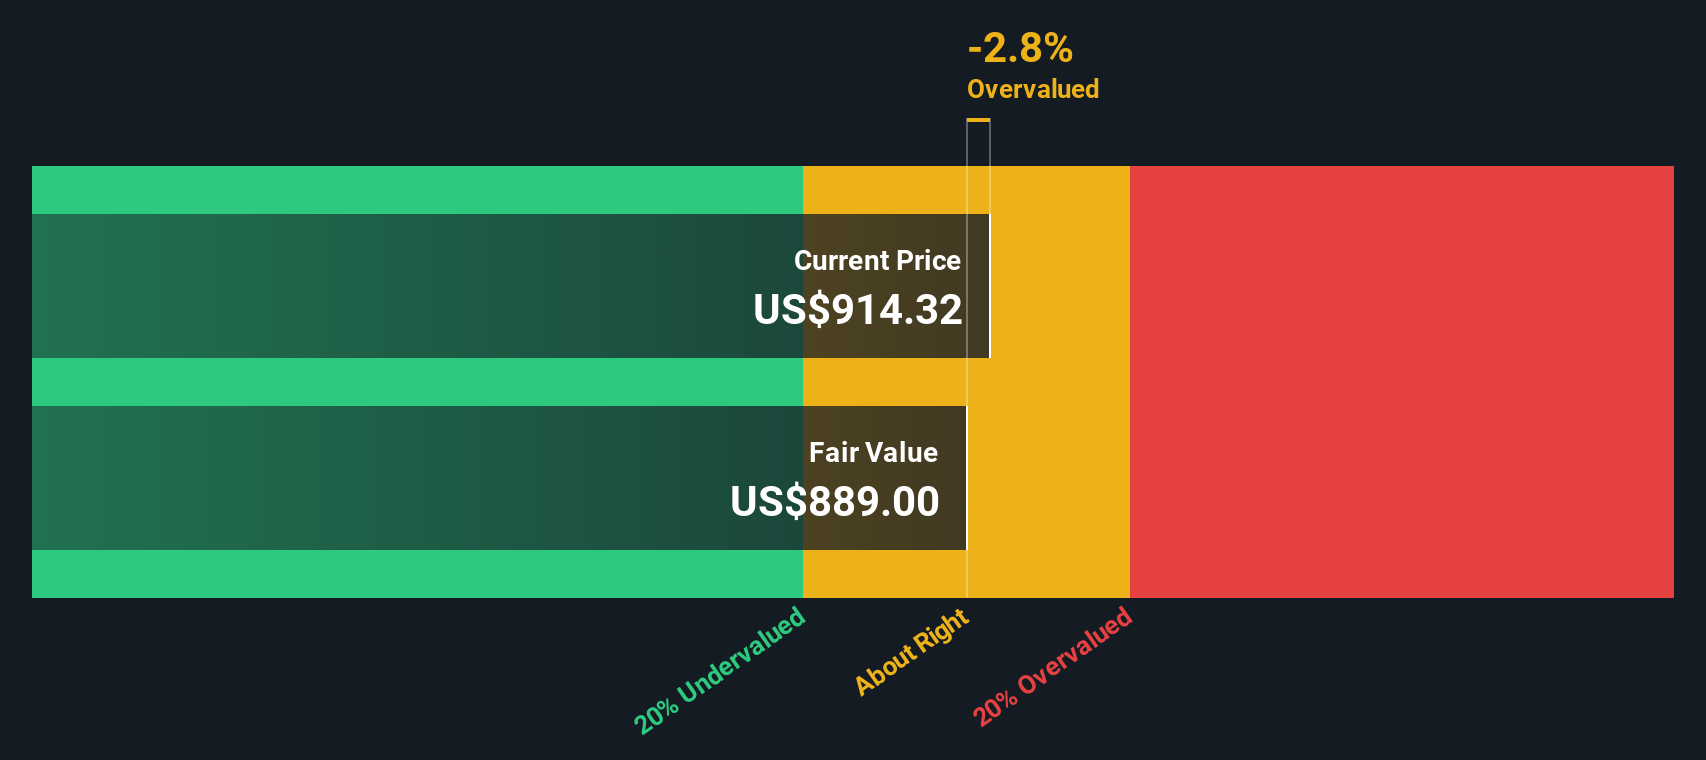
By discounting these projected cash flows back to today, the DCF model arrives at an intrinsic value of roughly $931 per share. Compared with the current market price, this framework indicates the shares trade at about a 16.1% discount, which reflects a more cautious outlook than the cash flow projections used in the model.
Result: UNDERVALUED
Our Discounted Cash Flow (DCF) analysis suggests ServiceNow is undervalued by 16.1%. Track this in your watchlist or portfolio, or discover 911 more undervalued stocks based on cash flows.
Approach 2: ServiceNow Price vs Earnings
For profitable, established software leaders like ServiceNow, the price to earnings ratio is often the cleanest way to gauge what investors are willing to pay for each dollar of current profit. A higher PE can be justified when markets expect strong, durable growth and see relatively low risk, while slower or more uncertain growth usually commands a lower, or more “normal” PE range.
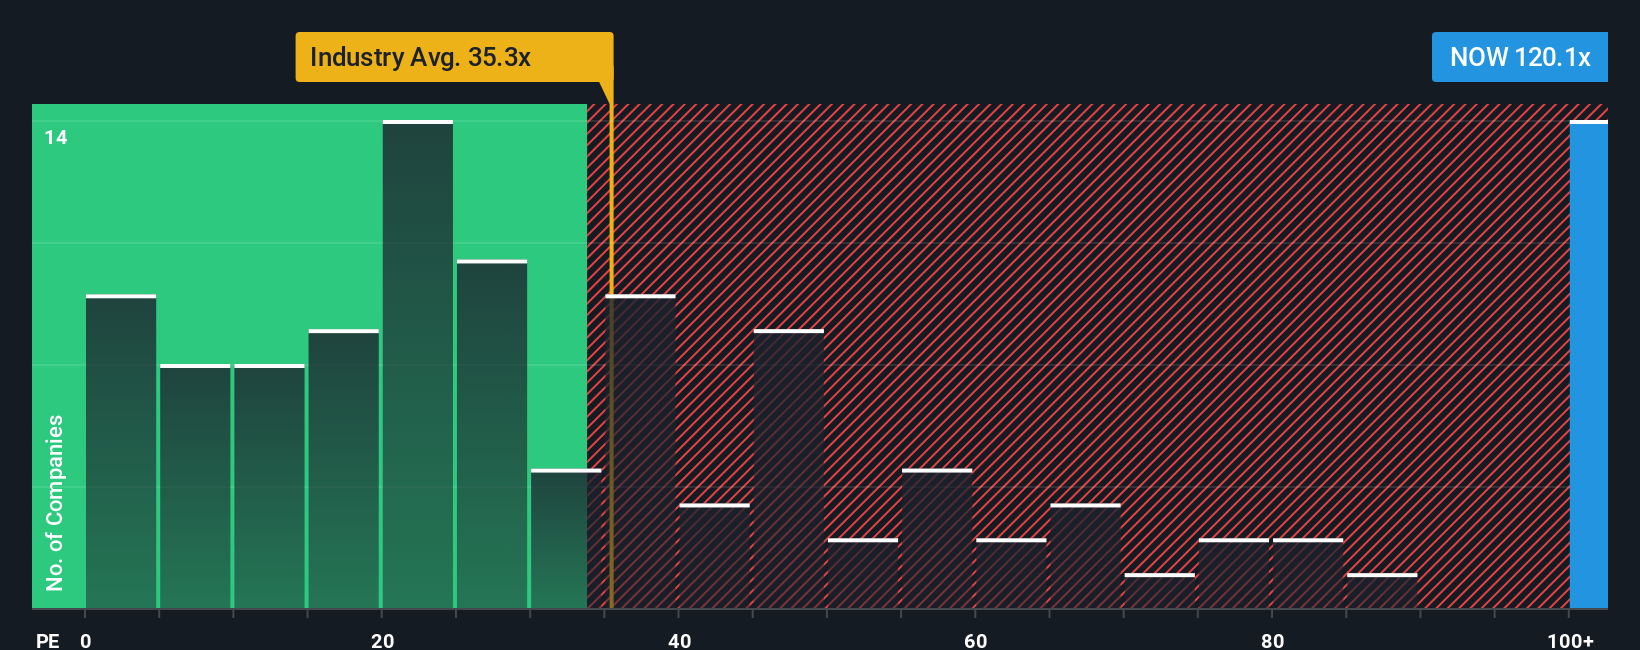
ServiceNow currently trades on about 93.6x earnings, which is well above both the broader Software industry average of roughly 32.4x and the peer group average near 51.2x. To put this into better context, Simply Wall St’s proprietary Fair Ratio model estimates a PE of about 46.1x for ServiceNow, based on its earnings growth profile, profitability, industry, market cap and specific risk factors. This Fair Ratio is more informative than a simple comparison with peers or the sector because it adjusts for how fast the company is growing and how secure those profits look over time.
Stacking the current 93.6x PE against the 46.1x Fair Ratio suggests the shares are pricing in considerably more optimism than our fundamentals based model supports at this stage.
Result: OVERVALUED
PE ratios tell one story, but what if the real opportunity lies elsewhere? Discover 1457 companies where insiders are betting big on explosive growth.
Upgrade Your Decision Making: Choose your ServiceNow Narrative
Earlier we mentioned that there is an even better way to understand valuation, so let us introduce you to Narratives, a simple way to attach your story about a company to the numbers behind its fair value, revenue, earnings and margin forecasts.
A Narrative links what you believe about a company, for example how AI, competitive dynamics or pricing will play out, to a concrete financial forecast and ultimately to a fair value estimate that you can compare with the current share price to help inform a buy, hold or sell decision.
On Simply Wall St, Narratives live in the Community page and are designed to be easy and accessible. They update dynamically as new information such as earnings results or major news comes in, so your fair value is always tied to the latest data rather than a static spreadsheet.
For ServiceNow, one investor Narrative might lean toward a higher fair value around $1,332 based on strong AI adoption, margin expansion and a still rich but easing future PE multiple. A more cautious Narrative could point to a fair value closer to $904 that assumes slower growth, margin pressure and a high required return. By comparing each to the current price you can quickly see which story, and which decision, makes more sense to you.
Do you think there's more to the story for ServiceNow? Head over to our Community to see what others are saying!

This article by Simply Wall St is general in nature. We provide commentary based on historical data and analyst forecasts only using an unbiased methodology and our articles are not intended to be financial advice. It does not constitute a recommendation to buy or sell any stock, and does not take account of your objectives, or your financial situation. We aim to bring you long-term focused analysis driven by fundamental data. Note that our analysis may not factor in the latest price-sensitive company announcements or qualitative material. Simply Wall St has no position in any stocks mentioned.
Have feedback on this article? Concerned about the content? Get in touch with us directly. Alternatively, email editorial-team@simplywallst.com