
- If you are wondering whether Veeva Systems at around $220 a share is still a quality growth story or quietly becoming a value opportunity, you are not alone in asking whether the recent pullback has finally made this stock interesting again.
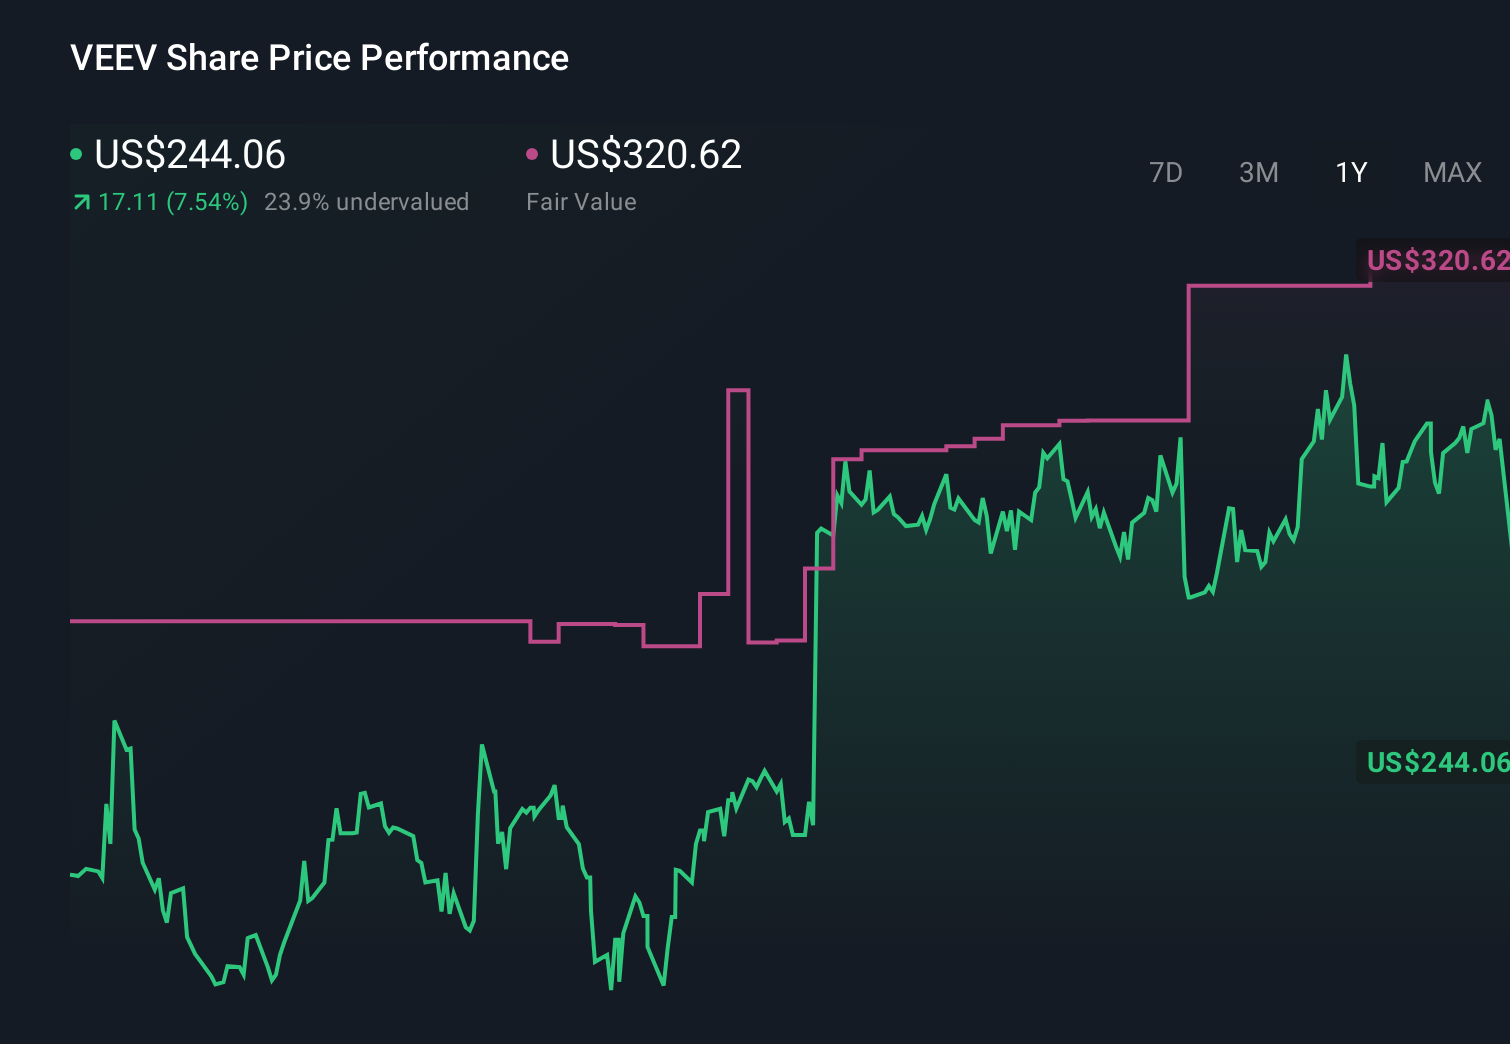
- Despite being up 4.5% year to date, the stock has dropped 5.1% over the last week and 25.0% over the last month, leaving it slightly down 2.8% over the past year but still up 33.9% over three years.
- Those swings come against a backdrop of Veeva steadily expanding its role as a core software partner for life sciences companies and continuing to invest in new cloud solutions that deepen its ecosystem. At the same time, investors have been reassessing richly valued software names in general, which has amplified short term volatility in otherwise high quality names such as Veeva.
- Right now, Veeva scores a 4/6 valuation score, suggesting it looks undervalued on most of our checks but not all. We will walk through what different valuation approaches say about the stock, and then finish with a more intuitive way to judge whether the current price really makes sense.
Approach 1: Veeva Systems Discounted Cash Flow (DCF) Analysis
A Discounted Cash Flow model estimates what a company is worth by projecting the cash it can generate in the future and discounting those cash flows back to today in $ terms.
For Veeva Systems, the latest twelve months Free Cash Flow is about $1.35 billion. Analysts and extrapolated estimates see this rising steadily, with forecast Free Cash Flow of roughly $2.38 billion by 2030, and further gradual growth after that. Simply Wall St uses a 2 Stage Free Cash Flow to Equity model, combining analyst forecasts for the next few years with longer term growth assumptions to build a 10 year cash flow profile.
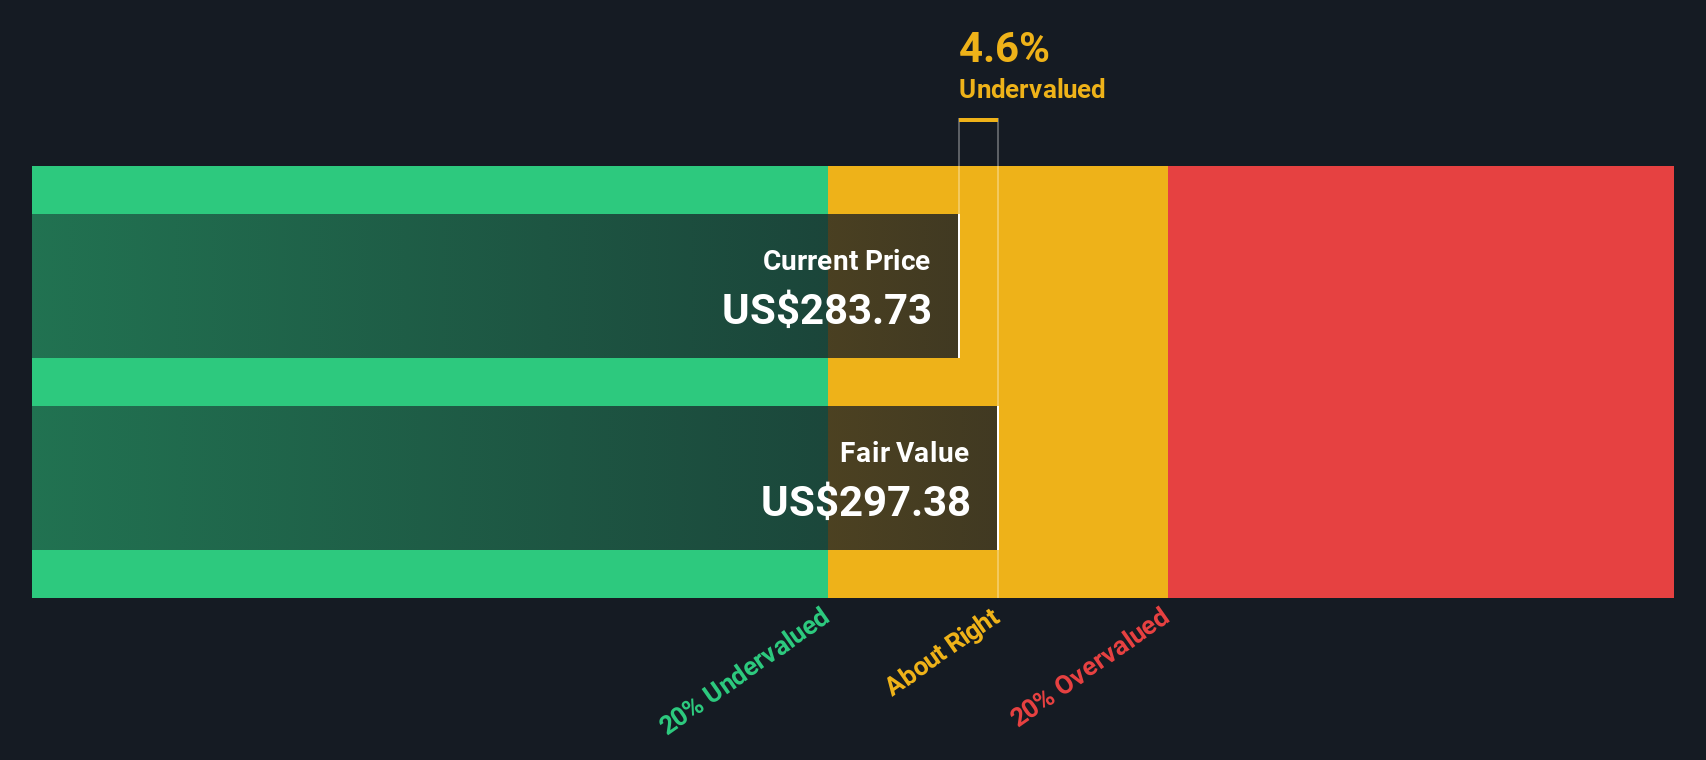
When all those projected cash flows are discounted back and summed, the model arrives at an estimated intrinsic value of about $288.94 per share. That implies the current share price is roughly 23.8% below this fair value estimate. This suggests the stock looks attractive on a cash flow basis rather than expensive.
Result: UNDERVALUED
Our Discounted Cash Flow (DCF) analysis suggests Veeva Systems is undervalued by 23.8%. Track this in your watchlist or portfolio, or discover 913 more undervalued stocks based on cash flows.
Approach 2: Veeva Systems Price vs Earnings
For profitable companies like Veeva, the price to earnings ratio is a useful way to judge valuation because it links what investors pay today to the earnings the business is already generating. In general, higher expected growth and lower risk can justify a higher PE, while slower growth or higher uncertainty usually warrant a lower multiple.
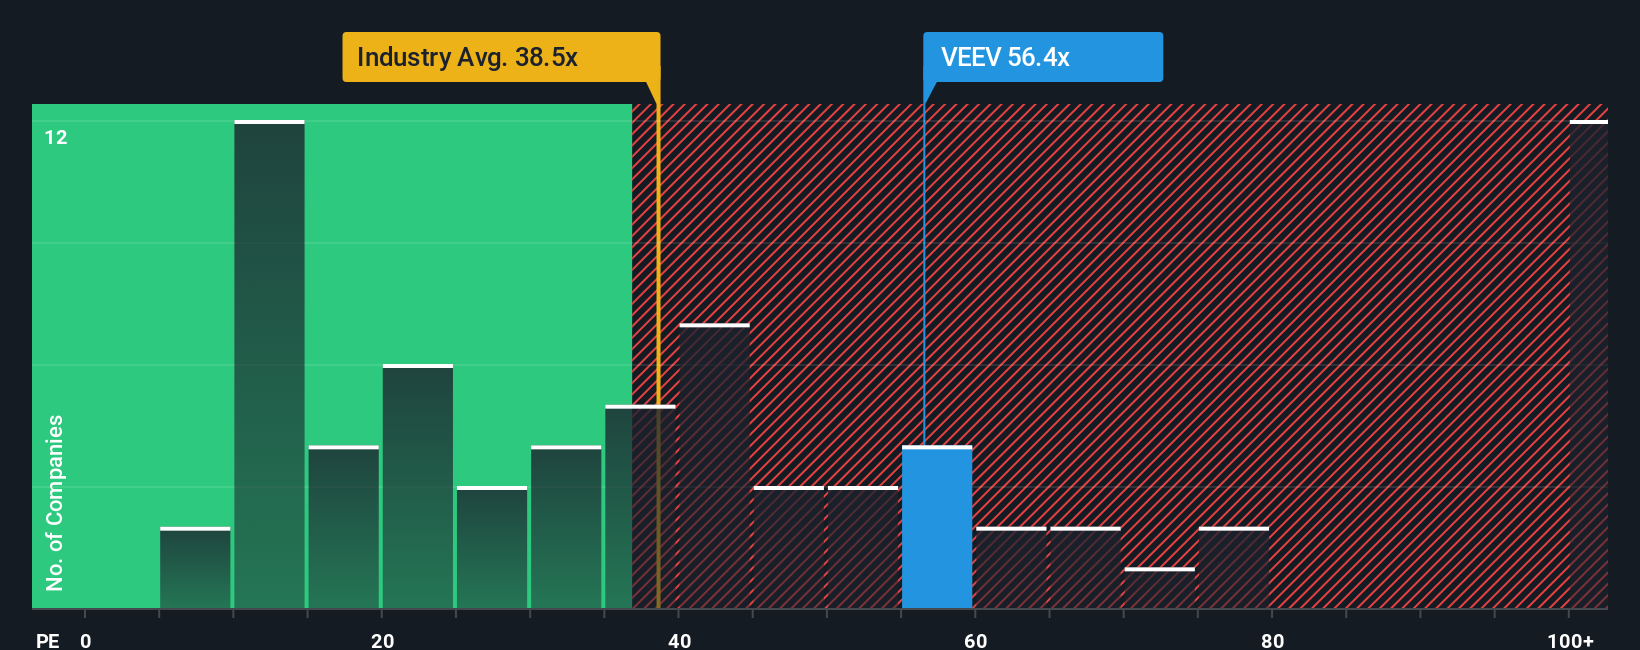
Veeva currently trades on about 42.1x earnings. That is below the average of its direct peers at roughly 61.6x, but somewhat above the broader Healthcare Services industry average of around 32.9x. To get beyond simple comparisons, Simply Wall St uses a Fair Ratio, which is the PE you would expect for Veeva given its specific mix of earnings growth, industry, profit margins, market cap and risk profile. For Veeva, this Fair Ratio is estimated at 31.9x.
Because this Fair Ratio incorporates company specific fundamentals rather than just comparing to often noisy peer or industry averages, it offers a more tailored benchmark. On that basis, Veeva's current 42.1x PE sits meaningfully above the 31.9x Fair Ratio, pointing to a stock that looks somewhat expensive on earnings.
Result: OVERVALUED
PE ratios tell one story, but what if the real opportunity lies elsewhere? Discover 1455 companies where insiders are betting big on explosive growth.
Upgrade Your Decision Making: Choose your Veeva Systems Narrative
Earlier we mentioned that there is an even better way to understand valuation, so let's introduce you to Narratives, which are simply the story you believe about a company, translated into explicit numbers like future revenue, earnings, margins and a fair value estimate. On Simply Wall St's Community page, millions of investors use Narratives as an easy tool to connect a company’s story to a financial forecast, which then flows directly into a fair value that can be compared against today’s share price to decide whether to buy, hold or sell. Because Narratives are updated dynamically as new information such as earnings, product launches or major news arrives, your view on a business can evolve in real time rather than being stuck on a static one off model. For Veeva, one investor might build a bullish Narrative around accelerating AI adoption, CRM wins and expanding margins that supports a fair value near $380, while a more cautious investor might focus on competitive pressure, execution risk and valuation, landing closer to $222, and Narratives makes both perspectives clear, quantified and directly comparable to the current price.
Do you think there's more to the story for Veeva Systems? Head over to our Community to see what others are saying!
This article by Simply Wall St is general in nature. We provide commentary based on historical data and analyst forecasts only using an unbiased methodology and our articles are not intended to be financial advice. It does not constitute a recommendation to buy or sell any stock, and does not take account of your objectives, or your financial situation. We aim to bring you long-term focused analysis driven by fundamental data. Note that our analysis may not factor in the latest price-sensitive company announcements or qualitative material. Simply Wall St has no position in any stocks mentioned.
Have feedback on this article? Concerned about the content? Get in touch with us directly. Alternatively, email editorial-team@simplywallst.com