
- If you are wondering whether Bruker is quietly turning into a value opportunity, or if the recent share price is still too rich for the risks on the table, you are in the right place.
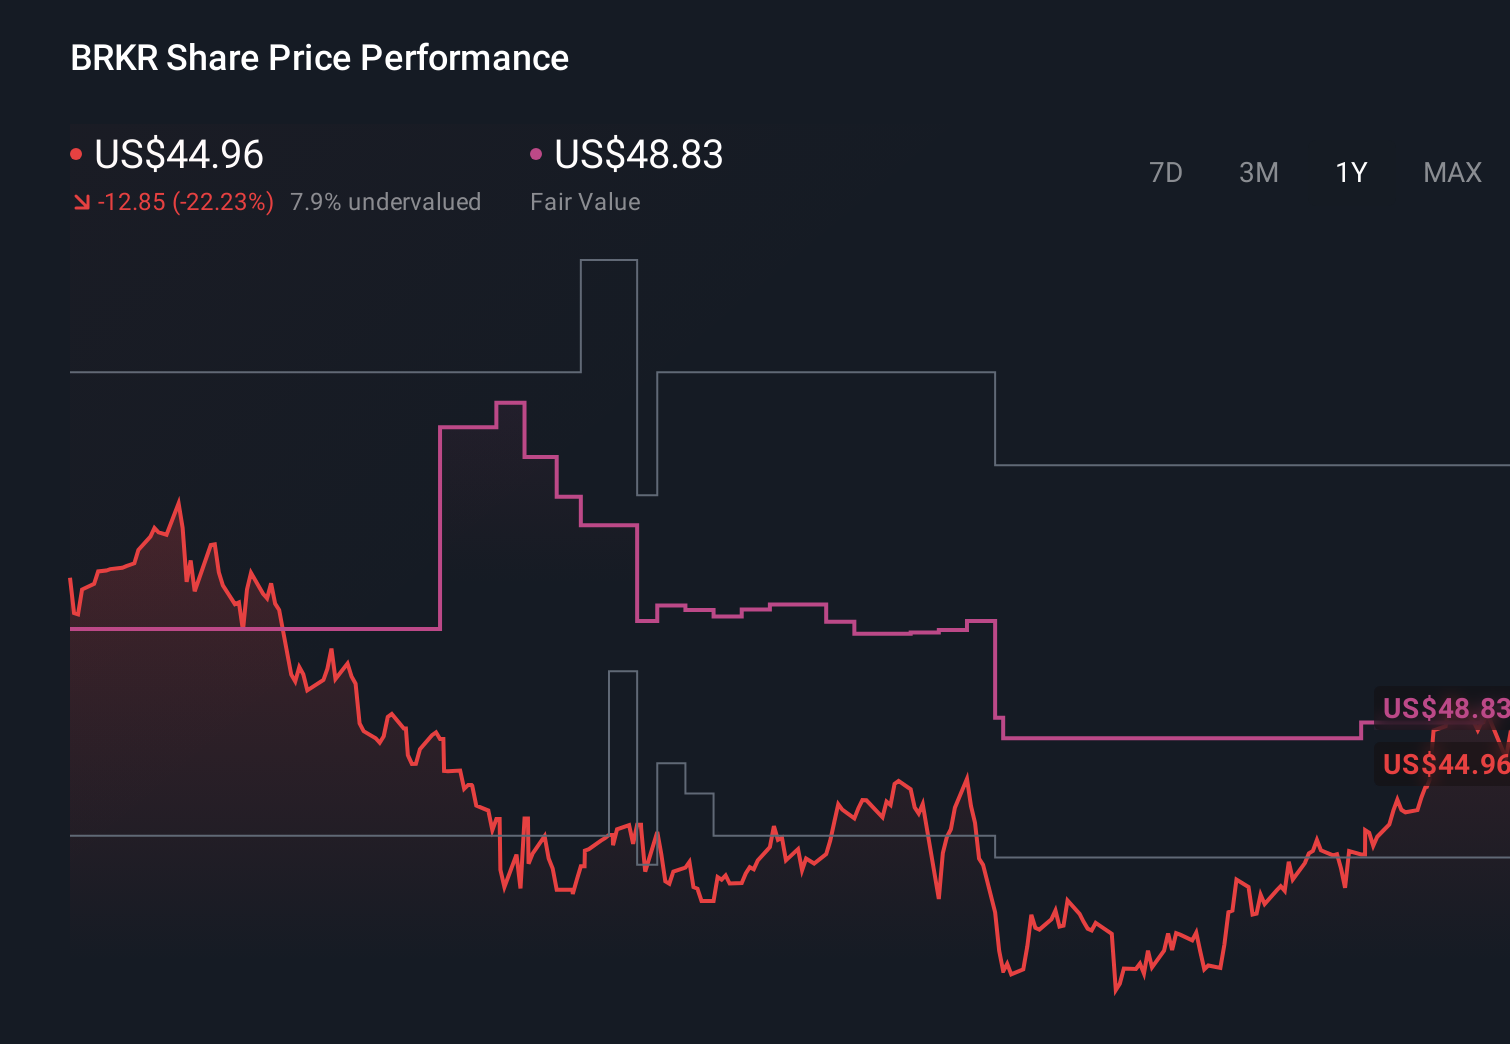
- After a tough stretch where the stock is still down 22.3% year to date and 20.6% over the last year, the recent 9.7% gain in the last 30 days and 0.7% move over the past week suggest that sentiment might be starting to shift.
- Recent headlines have focused on Bruker expanding its advanced scientific instruments portfolio and pushing deeper into high growth areas such as proteomics and life science research. These moves can change how investors think about its long term growth runway. At the same time, the market is reassessing specialized lab equipment players in light of longer investment cycles and changing research budgets, which helps explain some of the volatility in Bruker shares.
- Against that backdrop, Bruker currently scores a 3/6 valuation check score. This means it looks undervalued on half of our metrics. In the next sections, we will break down how different valuation approaches see the stock and introduce an additional way to interpret those signals by the end of the article.
Find out why Bruker's -20.6% return over the last year is lagging behind its peers.
Approach 1: Bruker Discounted Cash Flow (DCF) Analysis
A Discounted Cash Flow model estimates what a company is worth today by projecting its future cash flows and then discounting those projections back to the present.
For Bruker, the latest twelve month free cash flow is negative at around $23.4 Million, which means recent cash generation has been under pressure. Analysts and Simply Wall St then project a recovery, with free cash flow expected to reach roughly $336.3 Million in 2026 and about $374.4 Million by 2035, based on a 2 stage Free Cash Flow to Equity framework that blends analyst estimates with longer term extrapolations.
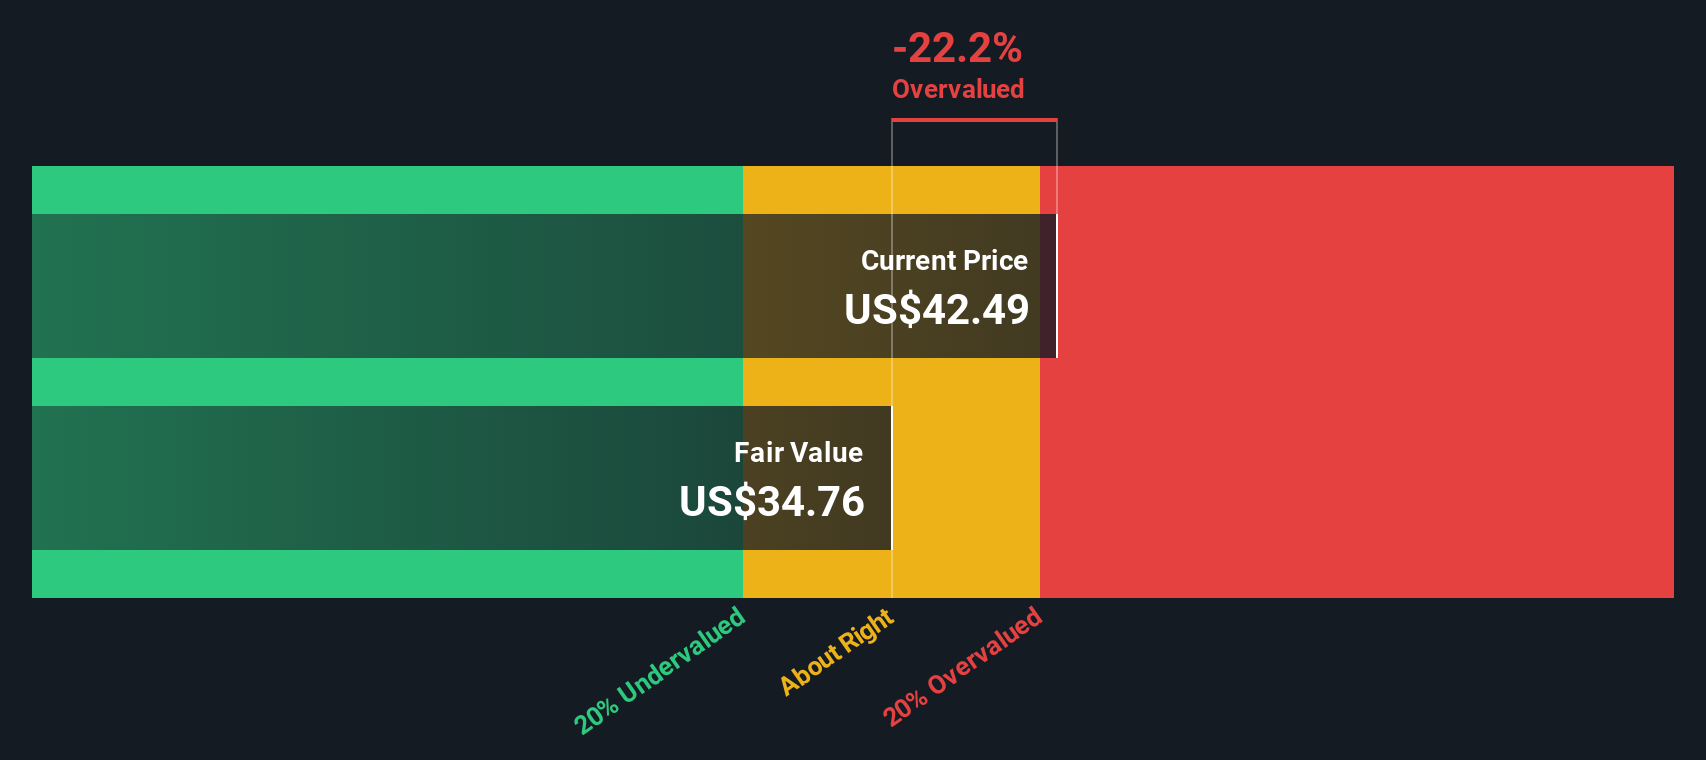
When these future cash flows are discounted back, the model suggests an intrinsic value of about $36.70 per share. Compared with the current share price, this implies Bruker is roughly 24.4% overvalued on a pure cash flow basis, signaling that a lot of future improvement is already priced in.
Result: OVERVALUED
Our Discounted Cash Flow (DCF) analysis suggests Bruker may be overvalued by 24.4%. Discover 906 undervalued stocks or create your own screener to find better value opportunities.
Approach 2: Bruker Price vs Sales
For many established, revenue generating businesses, the price to sales ratio is a practical way to gauge valuation because it sidesteps short term earnings noise and focuses on the top line investors are paying for. What counts as a normal or fair multiple tends to rise when a company has stronger growth prospects and lower perceived risk, and fall when growth is slower or earnings are more volatile.
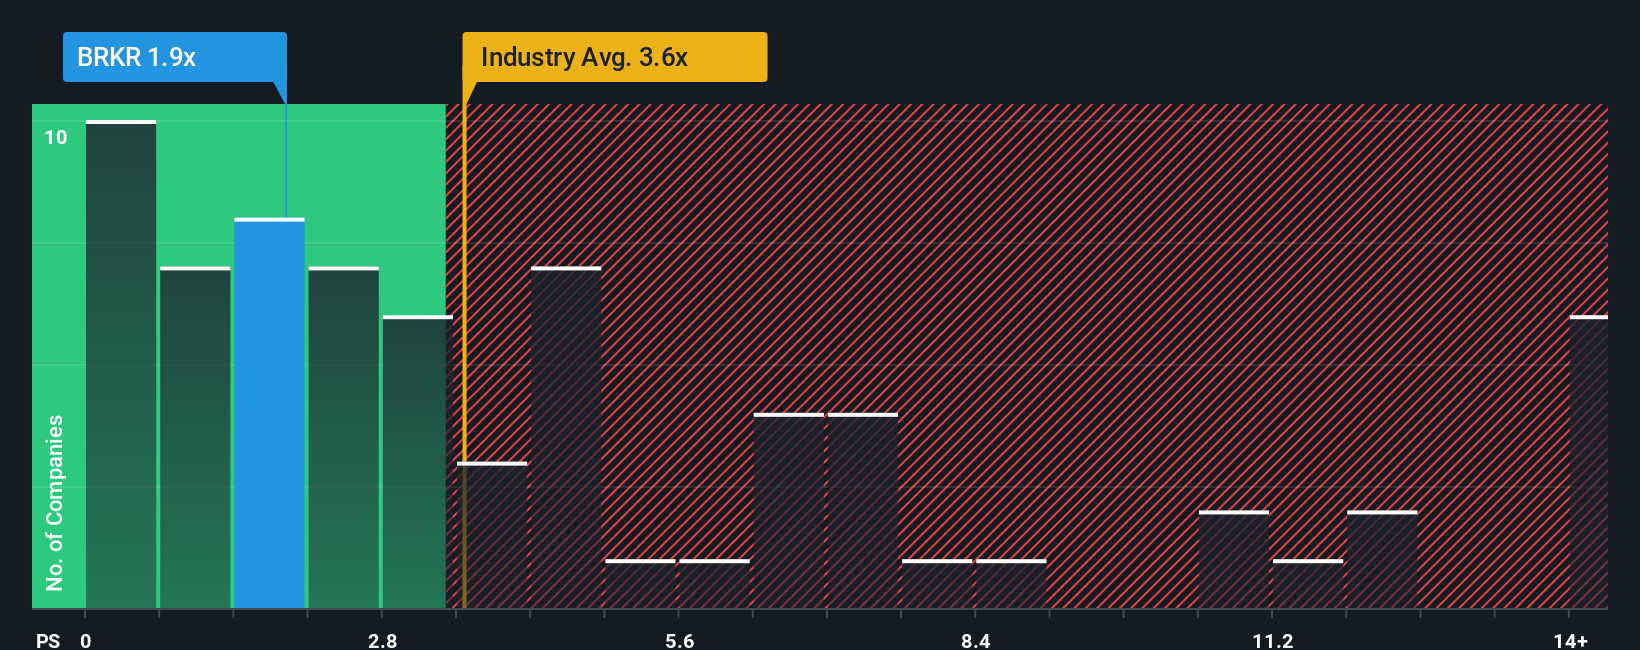
Bruker currently trades on a price to sales ratio of 2.02x. That is below both the Life Sciences industry average of about 3.33x and the broader peer group, which sits around 4.27x. Simply Wall St also calculates a proprietary Fair Ratio of 3.54x for Bruker, which reflects what its price to sales multiple should be given its specific growth outlook, profit margins, risk profile, industry positioning and market cap.
This Fair Ratio is more tailored than a simple comparison with peers or industry averages, because it adjusts for how Bruker differs from those groups rather than assuming all companies deserve the same multiple. With the Fair Ratio of 3.54x sitting well above the current 2.02x, the stock screens as undervalued on a sales based view.
Result: UNDERVALUED
PS ratios tell one story, but what if the real opportunity lies elsewhere? Discover 1448 companies where insiders are betting big on explosive growth.
Upgrade Your Decision Making: Choose your Bruker Narrative
Earlier we mentioned that there is an even better way to understand valuation, so let's introduce you to Narratives, a simple way to connect your view of Bruker’s story with a set of numbers for future revenue, earnings, margins and ultimately fair value. A Narrative is your investment storyline expressed as a forecast, linking what you believe about Bruker’s markets, products and execution to a concrete financial model and a fair value that you can compare with today’s share price. On Simply Wall St, Narratives are easy to build and follow from the Community page, where millions of investors share how their assumptions translate into a buy, hold or sell view as the gap between Fair Value and Price widens or narrows. Because Narratives update dynamically when new information like earnings, guidance changes or major news lands, they help you continuously test whether your original story still holds. For example, one Bruker Narrative might assume a fair value near the most bullish target of $65 if you expect funding to recover quickly and margins to expand strongly. A more cautious Narrative could anchor closer to the bearish $38 target if you think funding headwinds and execution risks will persist longer than the market expects.
Do you think there's more to the story for Bruker? Head over to our Community to see what others are saying!
This article by Simply Wall St is general in nature. We provide commentary based on historical data and analyst forecasts only using an unbiased methodology and our articles are not intended to be financial advice. It does not constitute a recommendation to buy or sell any stock, and does not take account of your objectives, or your financial situation. We aim to bring you long-term focused analysis driven by fundamental data. Note that our analysis may not factor in the latest price-sensitive company announcements or qualitative material. Simply Wall St has no position in any stocks mentioned.
Have feedback on this article? Concerned about the content? Get in touch with us directly. Alternatively, email editorial-team@simplywallst.com