
OSI Systems (OSIS) has been on a strong multi year run, yet the stock slipped about 2% in the latest session and is down roughly 5% over the past month.
See our latest analysis for OSI Systems.
Despite the recent 1 month share price pullback, OSI Systems is still trading at about $259.44 and its year to date share price return points to momentum that has been strong rather than fading, backed by multi year total shareholder returns that remain exceptional.
If OSI Systems has you rethinking what quality growth looks like in tech, it could be worth scanning high growth tech and AI stocks for other compelling opportunities on your radar.
With double digit earnings growth, robust multi year returns, and a still noticeable gap to analyst targets, investors now face a key question: Is OSI Systems quietly undervalued, or is the market already pricing in years of future growth?
Most Popular Narrative Narrative: 12.1% Undervalued
OSI Systems last closed at $259.44, while the most followed narrative pegs fair value higher, framing recent share weakness as a potential valuation mismatch.
Record backlog levels, global customer diversification beyond large legacy contracts like Mexico, and increased investment in R&D for differentiated platforms position OSI to accelerate earnings and free cash flow growth, and to better capitalize on long-term secular trends underpinning security and diagnostic infrastructure spending.
Want to see what powers that return and cash flow story? The narrative leans on steady revenue expansion, rising margins, and a richer future earnings multiple. Curious how those moving parts combine into its fair value call?
Result: Fair Value of $295 (UNDERVALUED)
Have a read of the narrative in full and understand what's behind the forecasts.
However, stretched government payment cycles and persistent healthcare underperformance could quickly challenge the bullish case if cash flow or margins disappoint.
Find out about the key risks to this OSI Systems narrative.
Another Angle On Value
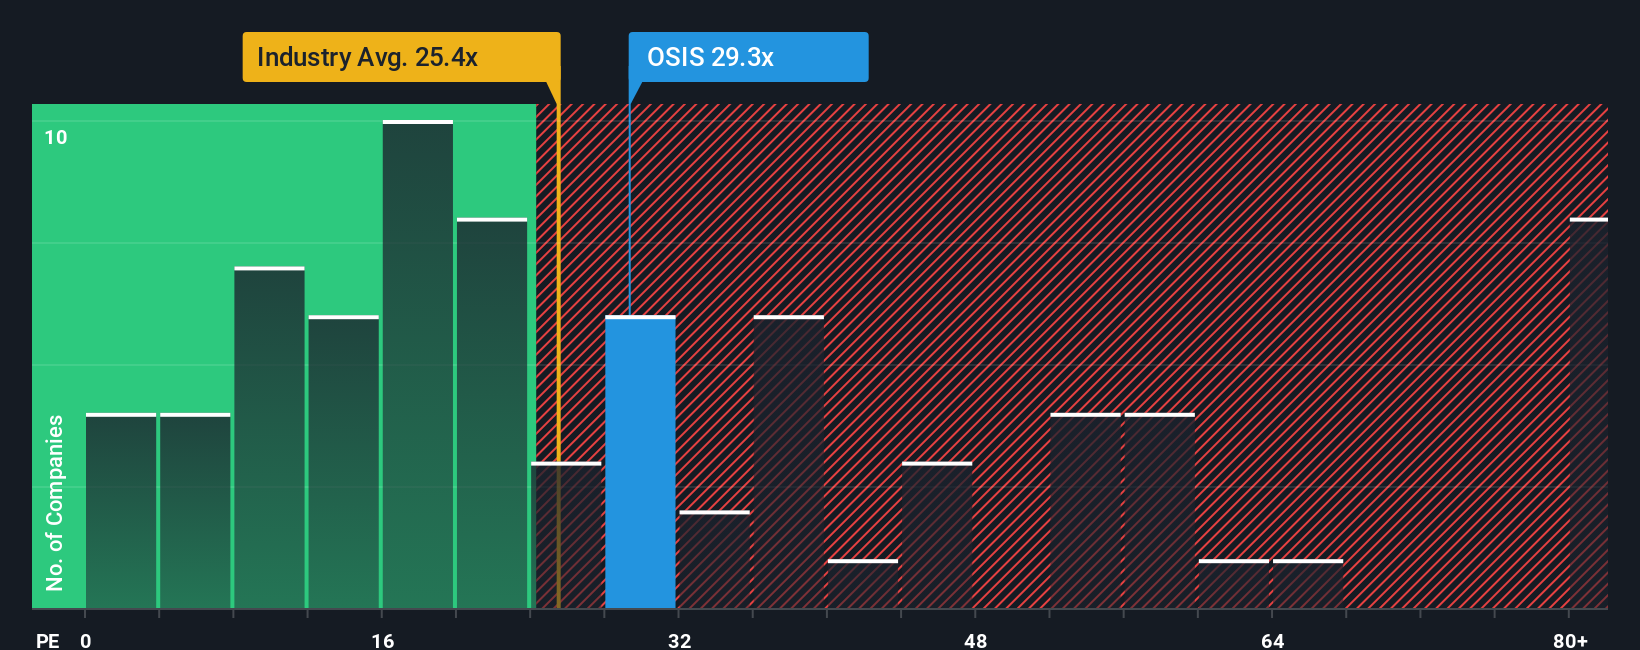
On earnings, OSI Systems looks pricey. It trades on a 28.9x P/E, richer than the US Electronic industry at 24.8x and above its 24.2x fair ratio, even though it is cheaper than peers at 38.9x. Is that premium a sign of strength or froth?
See what the numbers say about this price — find out in our valuation breakdown.
Build Your Own OSI Systems Narrative
If you see the story differently or want to dig into the numbers yourself, you can spin up a custom view in minutes: Do it your way
A great starting point for your OSI Systems research is our analysis highlighting 2 key rewards and 2 important warning signs that could impact your investment decision.
Ready for your next investing move?
Set yourself up for smarter decisions by using the Simply Wall St Screener to spot fresh opportunities before they hit everyone else's radar.
- Capture early momentum by scanning these 26 AI penny stocks that could benefit most as artificial intelligence spending accelerates worldwide.
- Lock in stronger cash flow potential with these 13 dividend stocks with yields > 3% that aim to pay you reliably while you hold.
- Position ahead of the market by tracking these 80 cryptocurrency and blockchain stocks riding structural shifts in digital assets and blockchain infrastructure.
This article by Simply Wall St is general in nature. We provide commentary based on historical data and analyst forecasts only using an unbiased methodology and our articles are not intended to be financial advice. It does not constitute a recommendation to buy or sell any stock, and does not take account of your objectives, or your financial situation. We aim to bring you long-term focused analysis driven by fundamental data. Note that our analysis may not factor in the latest price-sensitive company announcements or qualitative material. Simply Wall St has no position in any stocks mentioned.
Have feedback on this article? Concerned about the content? Get in touch with us directly. Alternatively, email editorial-team@simplywallst.com