
- If you have ever wondered whether Autodesk is actually worth its current price tag, you are not alone. This article is designed to unpack what the market might be missing.
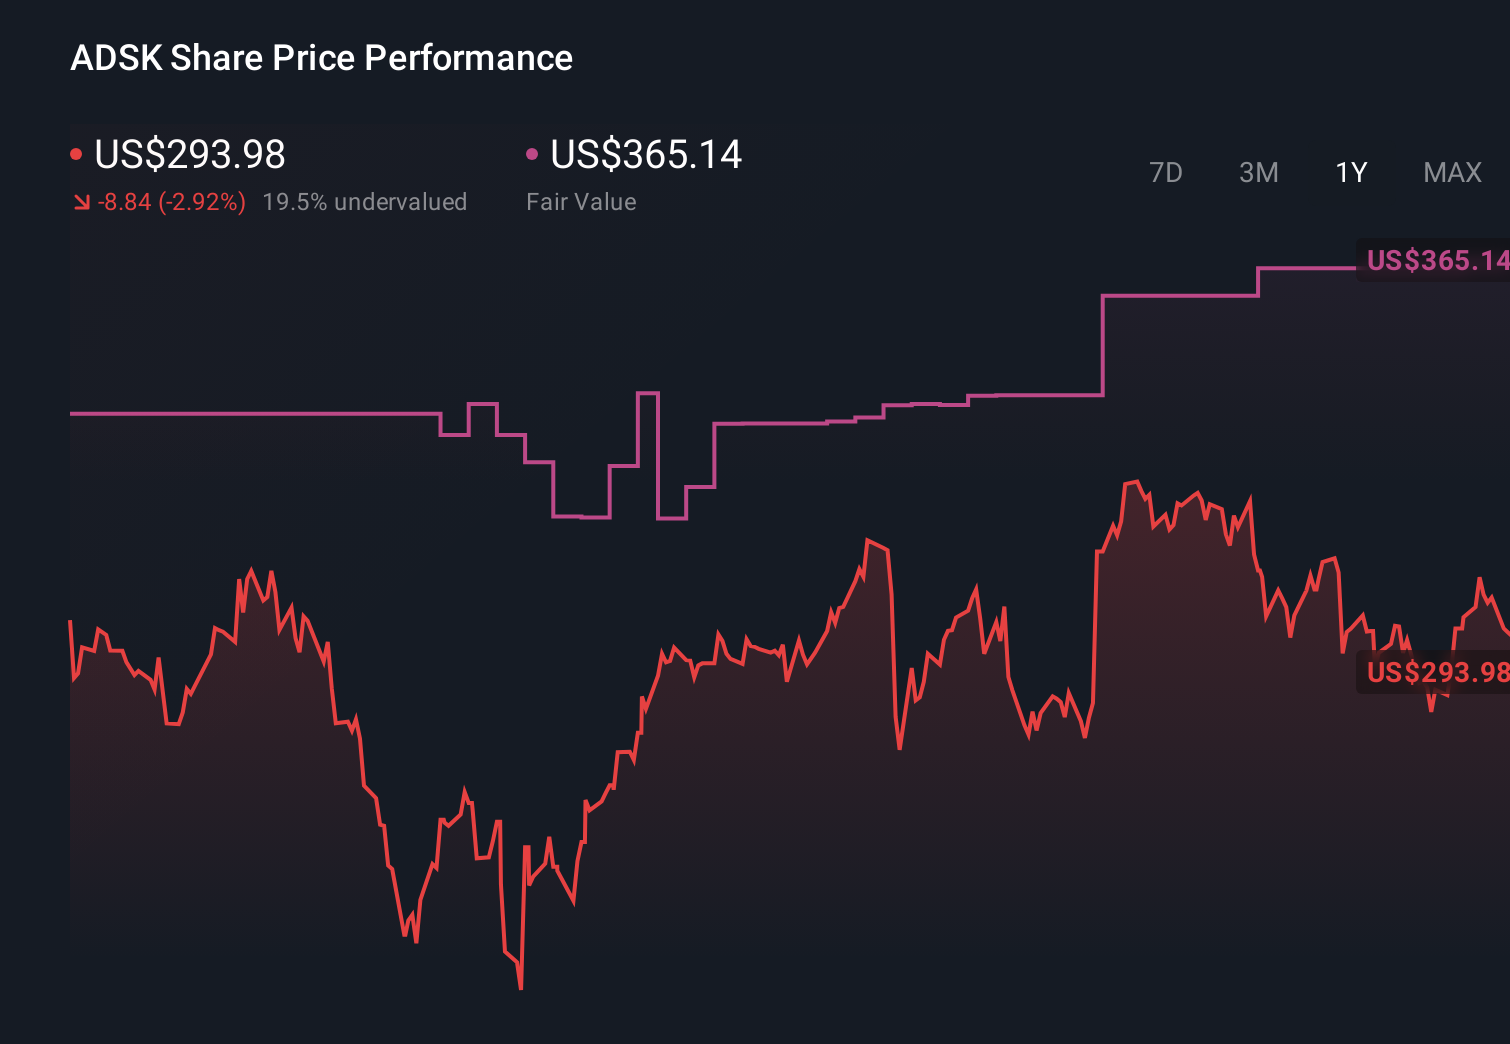
- The stock has been choppy lately, slipping around 2.3% over the last week and only 0.5% over the past month, but it is still up about 2.3% year to date and 50.0% over three years. This hints at a longer term growth story despite a slightly negative 1 year return of 2.4%.
- Recent attention on Autodesk has centered on its push deeper into cloud based design and construction workflows and the ongoing transition to more integrated subscription platforms. Both of these can reshape how investors think about its long term cash flows. At the same time, broader debate about software valuations and interest rates has kept sentiment volatile, helping to explain the uneven share price performance.
- On our framework, Autodesk currently scores a 2/6 valuation check, suggesting pockets of undervaluation but also some stretched metrics. Next we will break down what different valuation methods say, and then finish with an intuitive way to think about what this stock might really be worth.
Autodesk scores just 2/6 on our valuation checks. See what other red flags we found in the full valuation breakdown.
Approach 1: Autodesk Discounted Cash Flow (DCF) Analysis
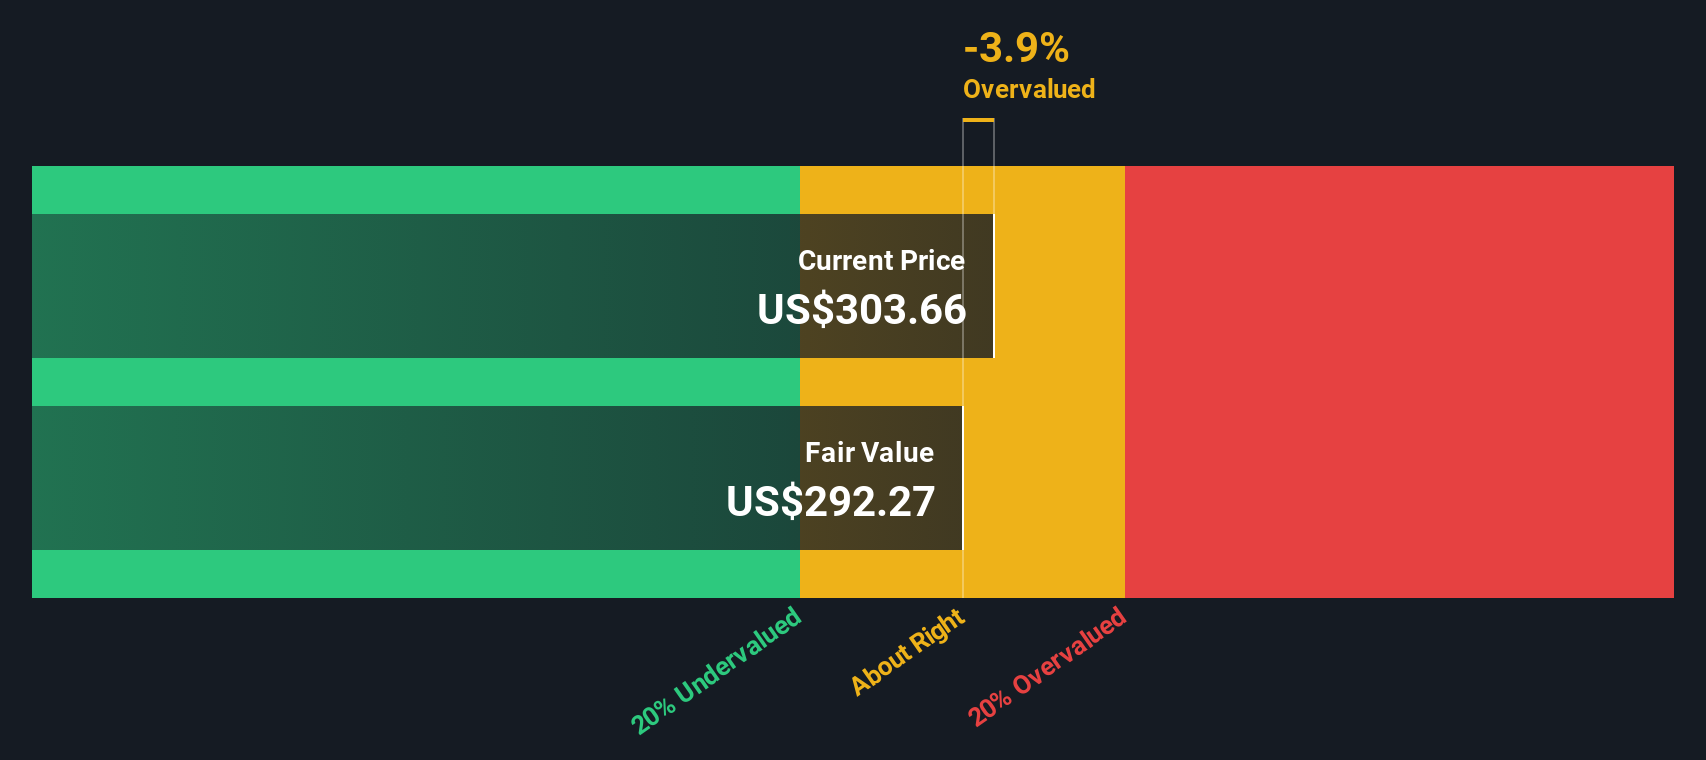
A Discounted Cash Flow model estimates what a business is worth by projecting the cash it can generate in the future and then discounting those cash flows back to today in dollar terms. For Autodesk, the 2 Stage Free Cash Flow to Equity model starts from last twelve month free cash flow of about $2.1 billion and builds in steady growth over time.
Analysts and extrapolations used in this model see Autodesk’s free cash flow rising to roughly $4.4 billion by 2035, with growth slowing gradually as the business matures. When all those projected cash flows are discounted back to today, the model arrives at an intrinsic value of about $279 per share.
That valuation suggests the stock is about 7.4% above where it should be on a pure cash flow basis, meaning Autodesk looks slightly overvalued but not dramatically mispriced.
Result: ABOUT RIGHT
Autodesk is fairly valued according to our Discounted Cash Flow (DCF), but this can change at a moment's notice. Track the value in your watchlist or portfolio and be alerted on when to act.
Approach 2: Autodesk Price vs Earnings
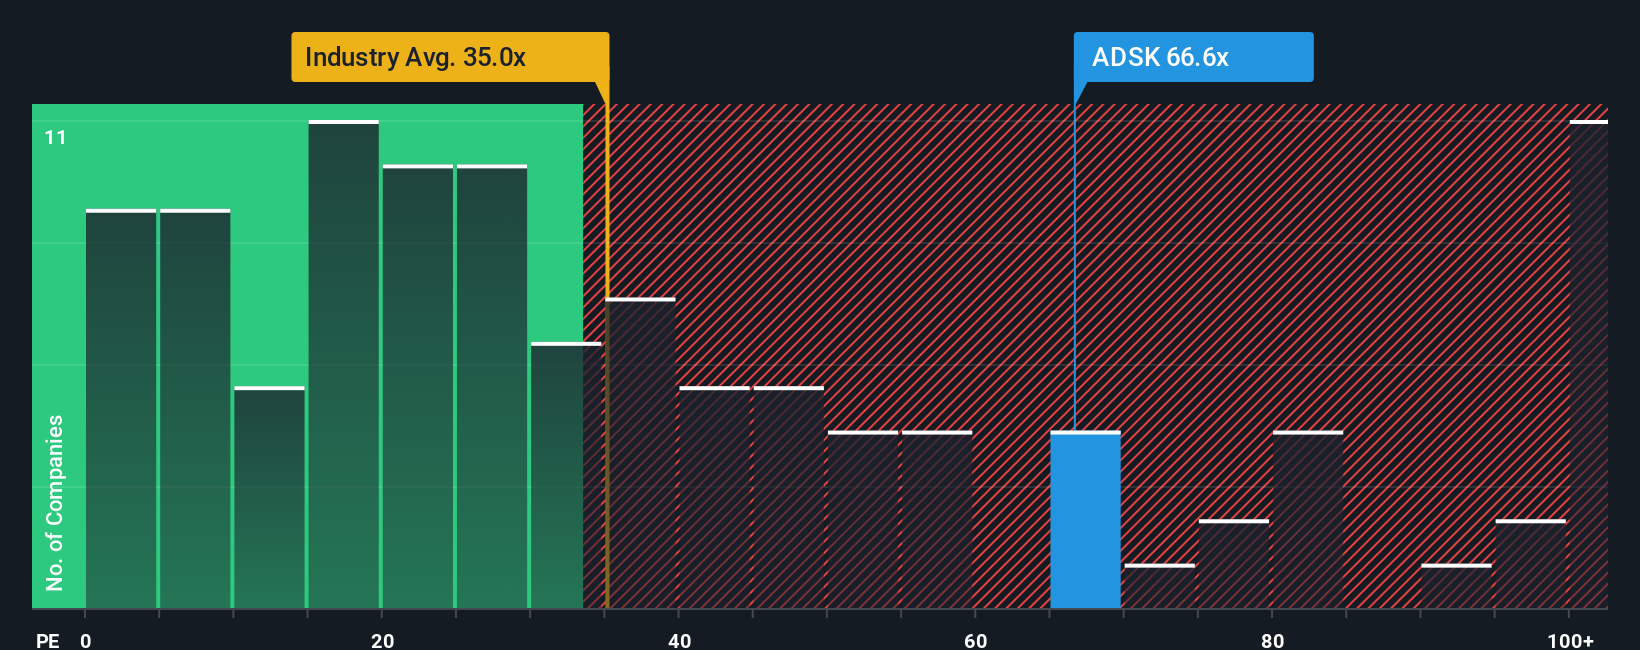
For a profitable software company like Autodesk, the price to earnings ratio is often the go to yardstick because it links what investors pay today directly to the earnings the business is already generating. In simple terms, the faster and more reliably a company can grow those earnings, and the lower its perceived risk, the higher a “normal” or “fair” PE multiple investors are usually willing to pay.
Autodesk currently trades on a PE of about 57.2x, which is well above the broader Software industry average of roughly 31.9x and still below a peer group average closer to 71.5x. To move beyond blunt comparisons, Simply Wall St uses a proprietary “Fair Ratio” of 39.1x. This reflects Autodesk’s specific mix of earnings growth prospects, profitability, risk profile, industry positioning and market cap. This makes it more tailored than simply lining the stock up against generic industry or peer multiples that may have very different growth and risk characteristics.
Stacking Autodesk’s actual 57.2x PE against the 39.1x Fair Ratio suggests the market is asking investors to pay a premium that is not fully supported by its fundamentals.
Result: OVERVALUED
PE ratios tell one story, but what if the real opportunity lies elsewhere? Discover 1446 companies where insiders are betting big on explosive growth.
Upgrade Your Decision Making: Choose your Autodesk Narrative
Earlier we mentioned that there is an even better way to understand valuation, so let us introduce you to Narratives. A Narrative is simply your story about a company expressed through numbers, where you translate your view of Autodesk’s products, competitive position and industry trends into assumptions for future revenue, earnings and margins, which then flow through to a fair value estimate. Narratives link three things together in a single, easy to use framework: the business story, the financial forecast and the resulting fair value, and they are available directly in the Community page on Simply Wall St, which millions of investors use. Once you have a Narrative, you can compare its Fair Value to the current share price to decide whether Autodesk looks like a buy, a hold or a sell, and the platform will update that Narrative dynamically as new news, earnings or guidance arrive. For example, one Autodesk Narrative on the platform might justify a fair value close to $430 if you expect strong margin expansion and robust AI driven growth, while a more cautious Narrative might land nearer $271 if you see slower adoption and rising competitive pressure.
Do you think there's more to the story for Autodesk? Head over to our Community to see what others are saying!
This article by Simply Wall St is general in nature. We provide commentary based on historical data and analyst forecasts only using an unbiased methodology and our articles are not intended to be financial advice. It does not constitute a recommendation to buy or sell any stock, and does not take account of your objectives, or your financial situation. We aim to bring you long-term focused analysis driven by fundamental data. Note that our analysis may not factor in the latest price-sensitive company announcements or qualitative material. Simply Wall St has no position in any stocks mentioned.
Have feedback on this article? Concerned about the content? Get in touch with us directly. Alternatively, email editorial-team@simplywallst.com